Datadog
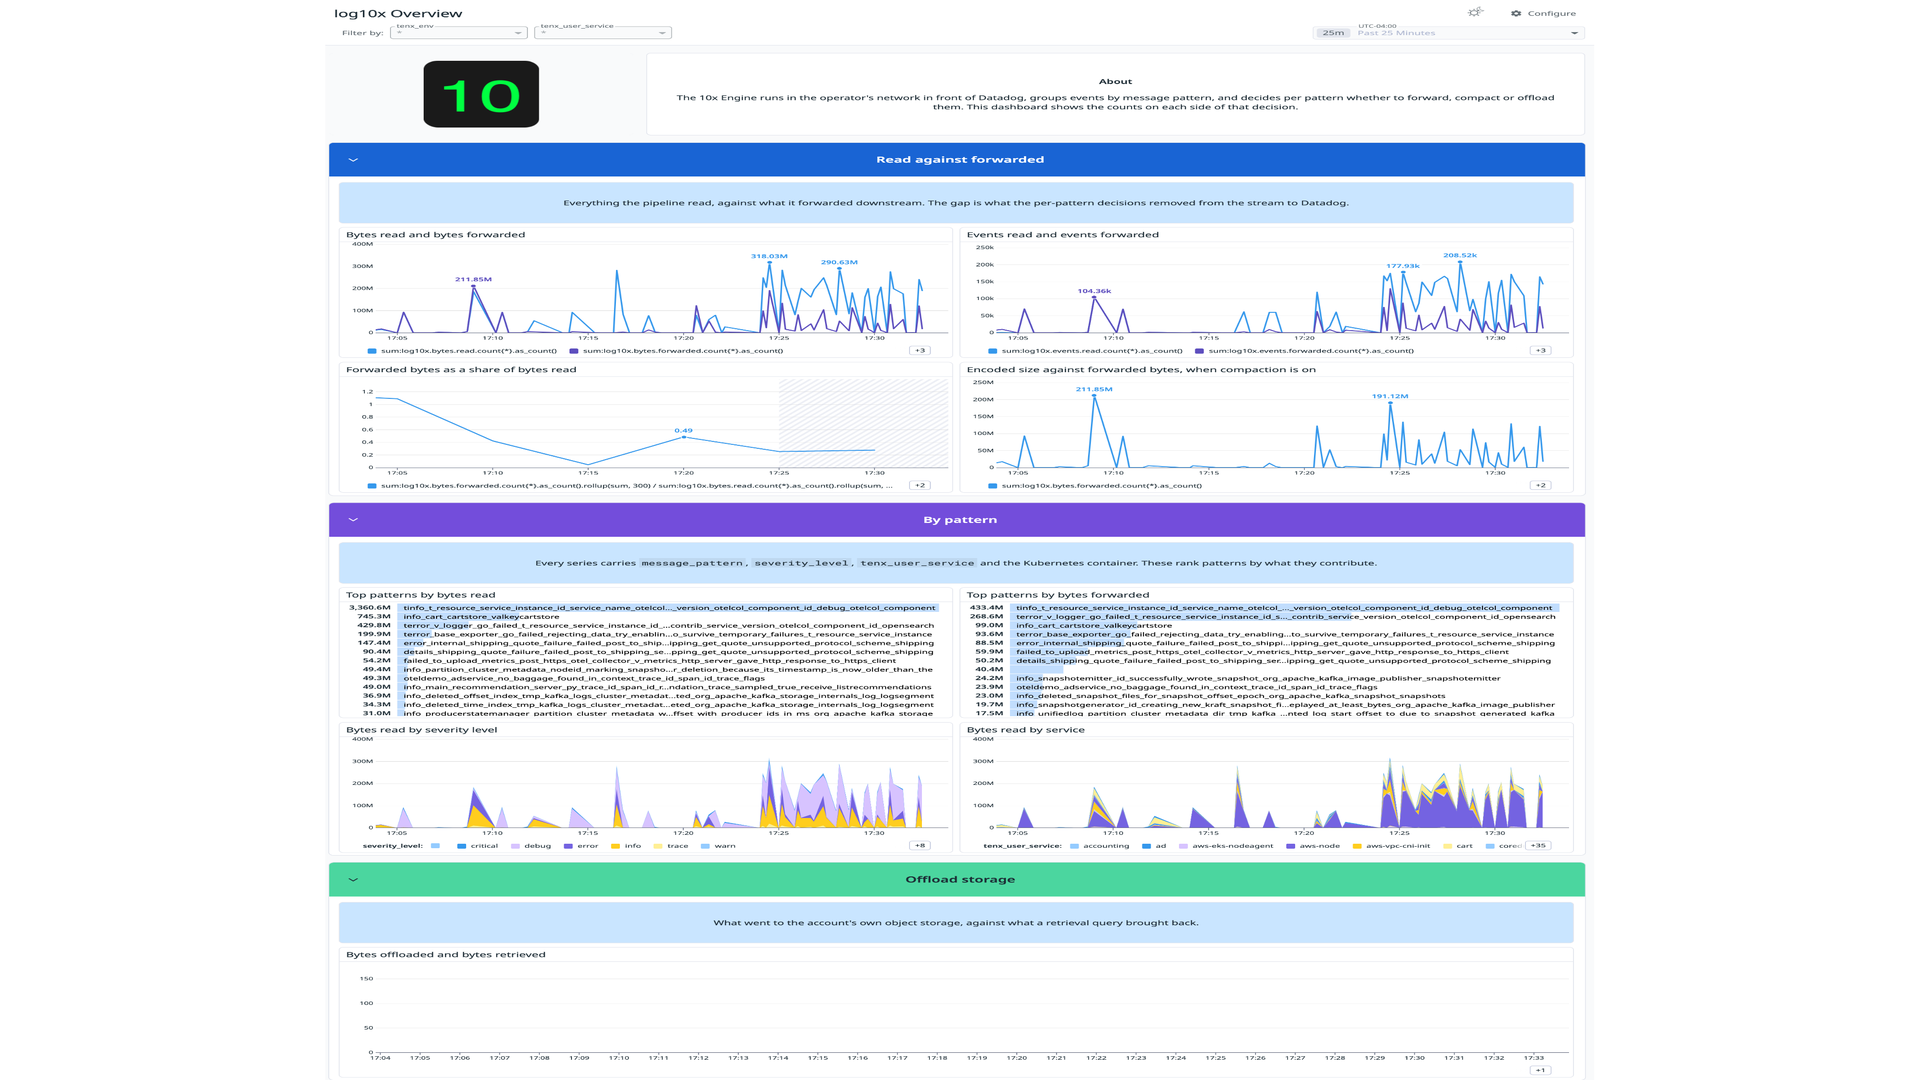
Install the log10x Datadog Agent check. It reads the 10x Engine's Prometheus metrics endpoint and submits per-pattern log volume and byte counters to Datadog: what the pipeline read, what it forwarded, the encoded size when compaction is on, and, from the Retriever, what went to offload storage and came back by query. The Datadog Agent scrapes the engine; the engine is not configured with any Datadog credential.
Catalogue status
The check is submitted to Datadog's integrations catalogue as DataDog/integrations-extras#3157. Until Datadog merges and publishes it, install the wheel from the log-10x/datadog-integration release as below. After publication the same check installs with datadog-agent integration install -t datadog-log10x==1.0.0 and its dashboard and monitors appear in Datadog without the import step.
10x Engine
- In the app configuration file, under Select Metric Outputs, uncomment the Prometheus scrape output, or pass it at launch:
-
Restart the pipeline. At startup the engine prints
Publishing TenXSummary metrics to Prometheusfollowed by the port it listens on, 9100 by default. To change the port, editportinrun/output/metric/prometheus/scrape/config.yaml. -
Confirm the endpoint serves series once the first aggregation flush has landed, about two seconds into traffic:
Datadog Agent
- Download the wheel and install it on the Agent host. Community integrations are not bundled with the Agent.
curl -LO https://github.com/log-10x/datadog-integration/releases/download/v1.0.0/datadog_log10x-1.0.0-py3-none-any.whl
sudo -u dd-agent datadog-agent integration install -w ./datadog_log10x-1.0.0-py3-none-any.whl
For a containerised Agent, add the wheel in a Dockerfile layer on `datadog/agent:7`:
FROM datadog/agent:7
COPY datadog_log10x-1.0.0-py3-none-any.whl /tmp/
RUN agent integration install -r -w /tmp/datadog_log10x-1.0.0-py3-none-any.whl
- Create
conf.d/log10x.d/conf.yamlpointing at the engine's endpoint:
On Kubernetes, put the same instance in an [Autodiscovery](https://docs.datadoghq.com/containers/kubernetes/integrations/) annotation on the engine's pod instead, with `%%host%%` in place of `localhost`.
- Restart the Agent, then confirm the check is running:
- Import the dashboard. Until the catalogue entry is live, create it from the JSON in the repository through the dashboard API or Dashboards → New Dashboard → Import:
curl -LO https://raw.githubusercontent.com/log-10x/datadog-integration/v1.0.0/assets/dashboards/log10x_overview.json
The two monitor templates are in `assets/monitors/` of the same repository.
What arrives
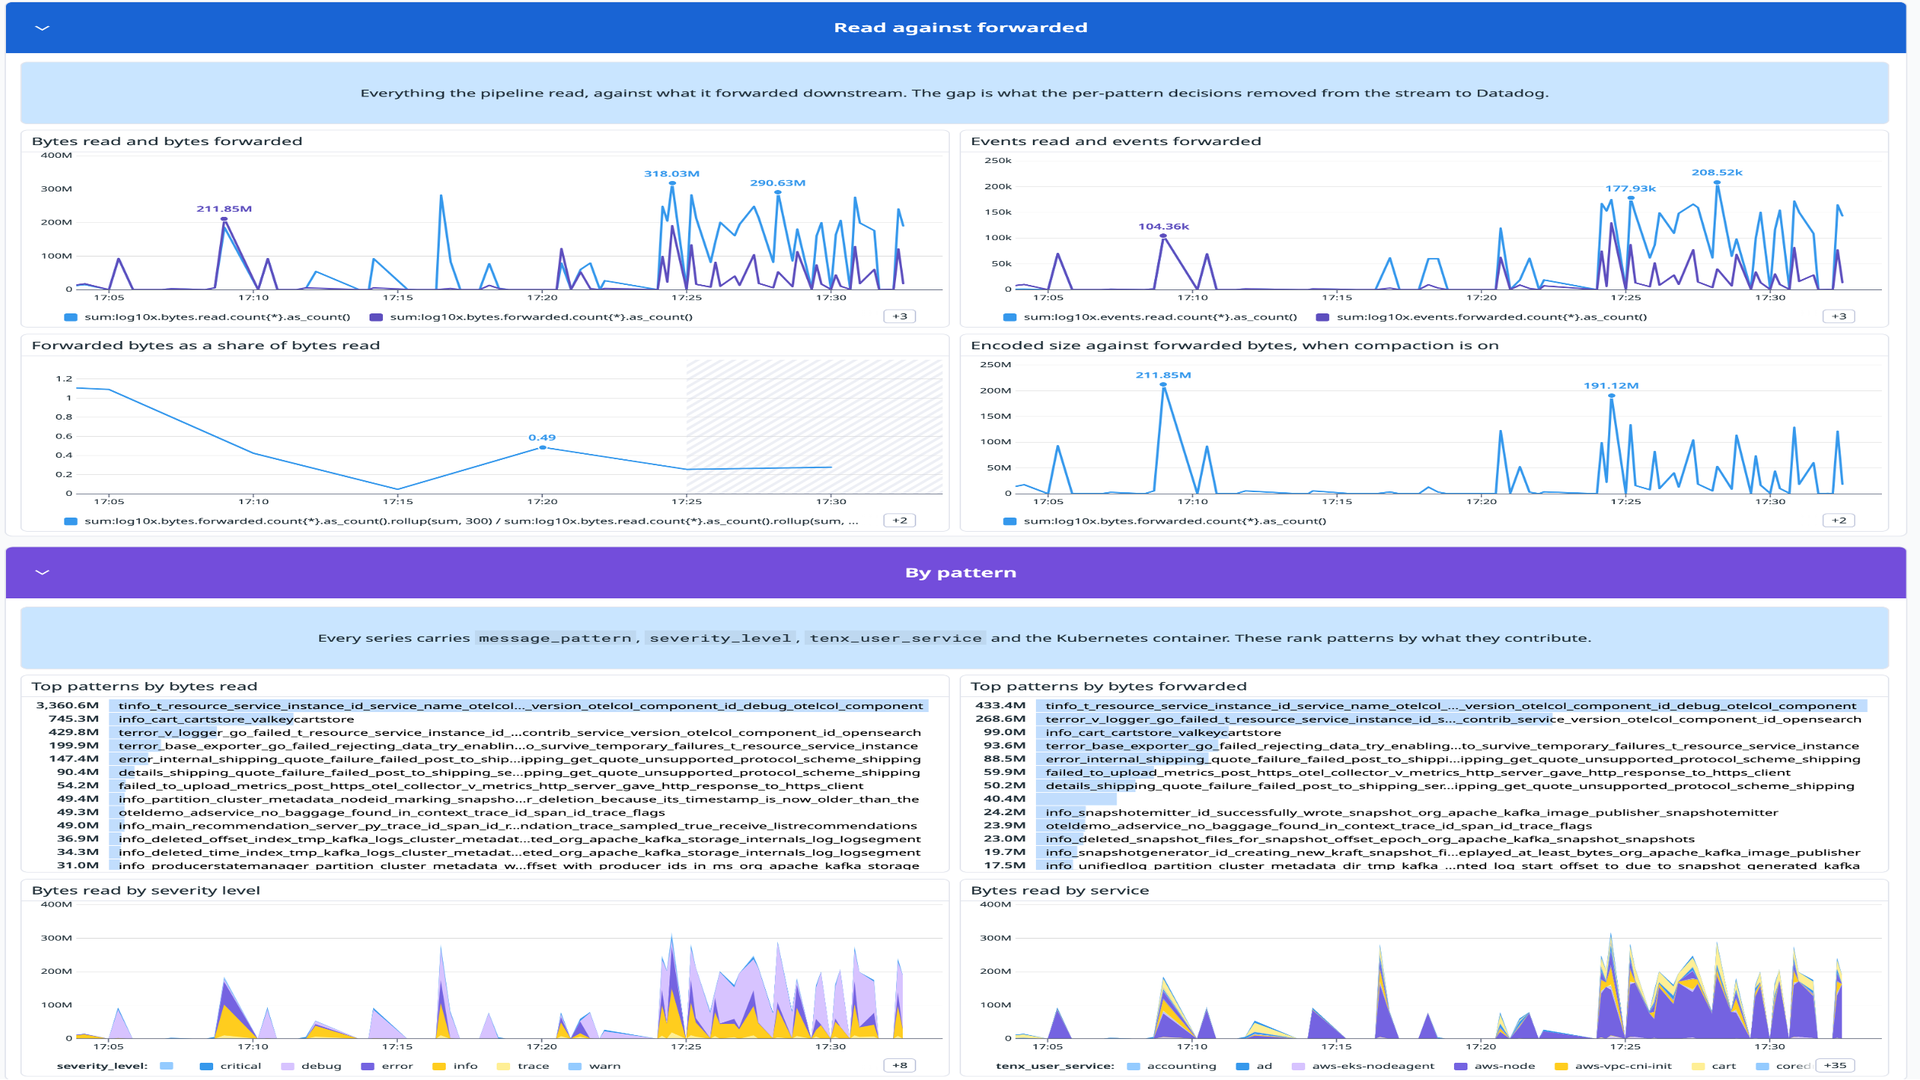
Every metric is prefixed log10x. and carries the engine's enrichment fields as tags: message_pattern, severity_level, tenx_user_service, tenx_app, tenx_env, k8s_namespace, k8s_container, http_code.
Datadog counts a custom metric for each combination of a metric name and its tag values, so each message_pattern value adds metrics, and it bills custom metrics above the plan's allotment (custom metrics billing).
| Metric | Type | Unit | Emitted by | Counts |
|---|---|---|---|---|
log10x.check.up |
gauge | the check | 1 on every run of the check | |
log10x.events.read.count |
count | event | pipeline | events the pipeline read |
log10x.bytes.read.count |
count | byte | pipeline | bytes the pipeline read |
log10x.events.forwarded.count |
count | event | pipeline | events forwarded downstream |
log10x.bytes.forwarded.count |
count | byte | pipeline | bytes forwarded downstream |
log10x.bytes.encoded.count |
count | byte | pipeline | encoded size of forwarded events when compaction is on |
log10x.events.offloaded.count |
count | event | Retriever index | events written to offload storage |
log10x.bytes.offloaded.count |
count | byte | Retriever index | bytes written to offload storage |
log10x.events.retrieved.count |
count | event | Retriever query | events a retrieval query returned |
log10x.bytes.retrieved.count |
count | byte | Retriever query | bytes a retrieval query returned |
The last four come from the Retriever, which runs as its own deployment, so the Agent needs a second instance pointing at it: on Kubernetes an Autodiscovery annotation on the index, query and stream pods. On Lambda the Retriever has no endpoint for the Agent to scrape, so those four metrics do not arrive through this check.
One service check, log10x.openmetrics.health, is CRITICAL when the Agent cannot reach the engine's endpoint and OK otherwise.
Troubleshooting
The check is not listed in datadog-agent status. Confirm the install step completed and that conf.d/log10x.d/conf.yaml exists, then restart the Agent.
log10x.openmetrics.health is CRITICAL. The Agent cannot reach the endpoint. Check the engine log for the Publishing TenXSummary metrics to Prometheus line and that the port it names matches conf.yaml.
Series arrive with no message_pattern tag. Pattern enrichment comes from the run/initialize/message module. Confirm it is included in the engine's app configuration.
Setting PROMETHEUS_SCRAPE_PORT aborts the engine on 1.1.45. The environment override is read as text where a number is required. Edit port in the scrape output's config.yaml instead.