Splunk
Search and visualize compact events in Splunk; the original lines of each event up to 256 KB expand back exactly at search time. This open-source app expands compact events at search time: classic dashboards keep their panels unchanged, the search bar wraps a query in one command, and an alert created in the app's Compile Alert view compiles once so the scheduler runs it natively.
Use the Reporter (DaemonSet, pre-ingestion) or the MCP server's SIEM-sample tool (agentless, via Splunk REST API) to identify optimization opportunities in your existing Splunk data.
Analytics Dashboard
The Analytics dashboard shows compact event counts, active templates, compression ratio and storage saved. It finds compact events through the tenx-events macro.
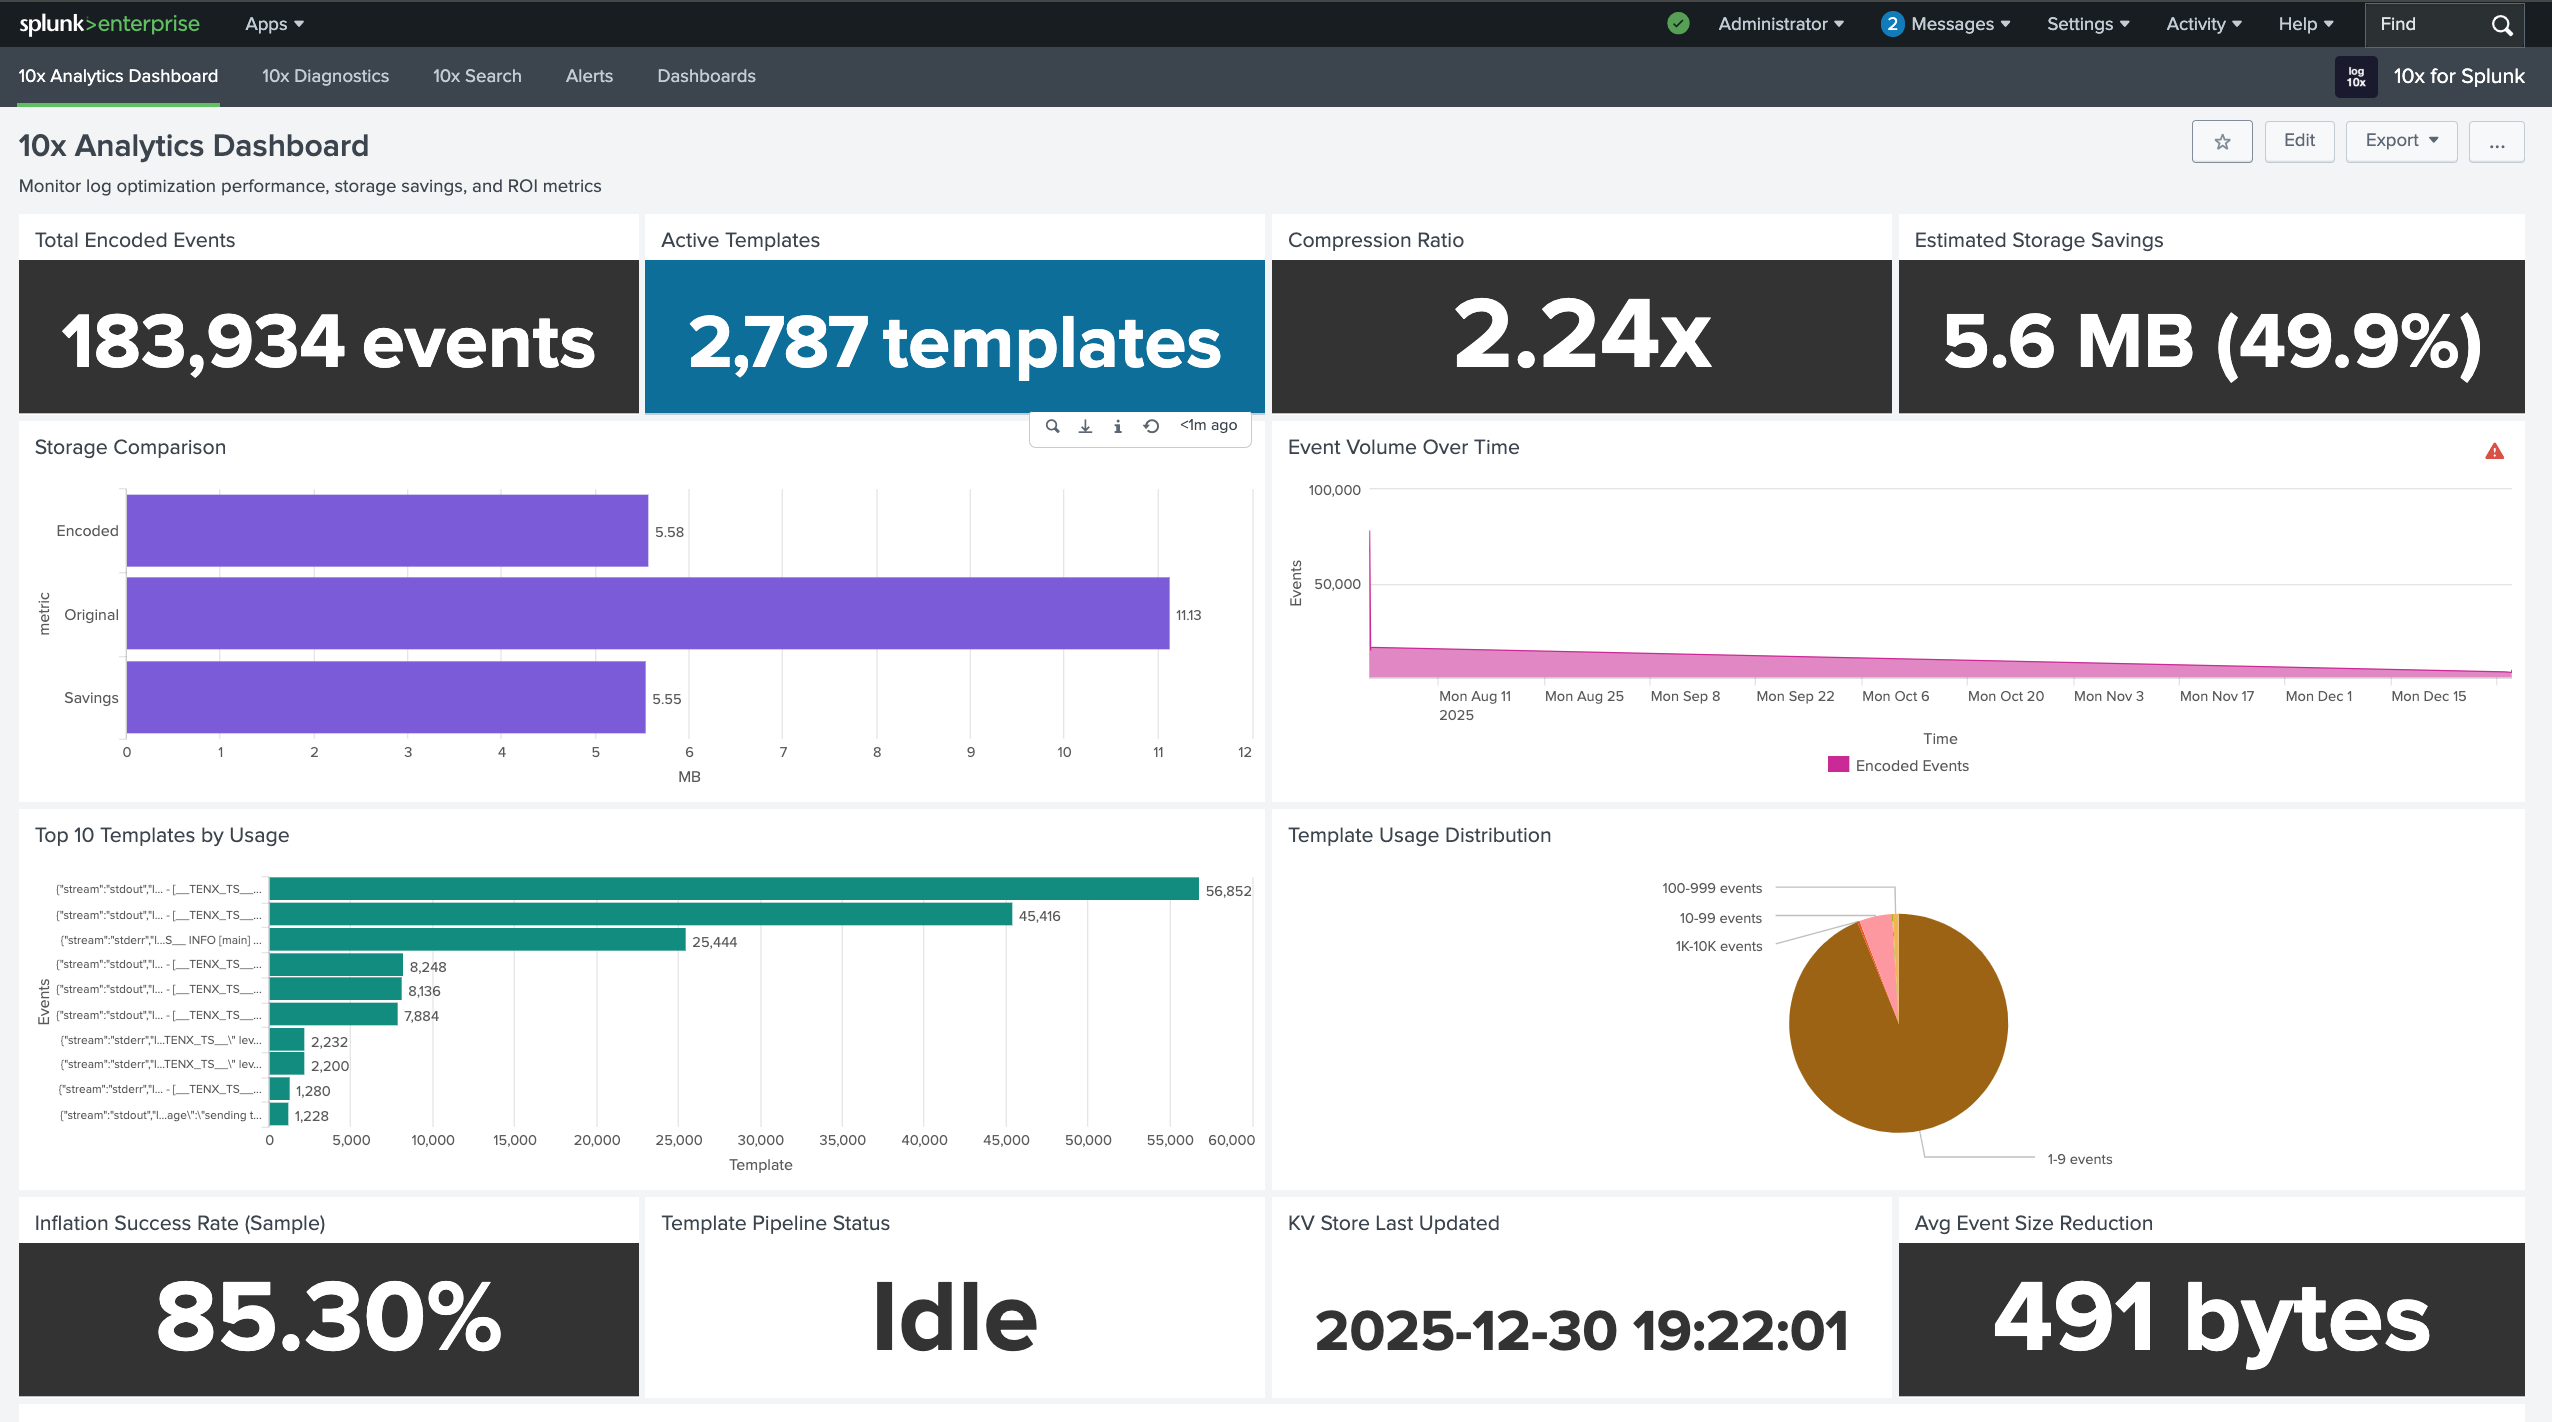
| Panel | Description |
|---|---|
| Total Encoded Events | Compact events indexed |
| Active Templates | Templates in the KV Store |
| Compression Ratio | Original size over compact size, on the latest 5,000 events |
| Estimated Storage Savings | Bytes saved and percentage reduction, on the latest 10,000 events |
| Event Volume, Last 7 Days | Compact events per hour |
| Top 10 Templates by Usage | Template hashes with the most events |
| Inflation Success Rate | Share of the latest 1,000 events that expand |
How It Works
A compact event carries a template hash and the event's variable values. The app reads the template hash into the field tenx_hash; in the engine's metrics, the label of that name holds the pattern hash. The constant words live in the KV Store, so the app puts them back at search time and re-applies the search to the expanded lines.
Classic dashboards keep their panels unchanged: the browser sends each panel's search to the app, which rewrites it on the server. Splunk's search page and Dashboard Studio load no app JavaScript, so a search typed in the search bar or in a Dashboard Studio panel starts with the app's tx command, which runs the same rewrite. An alert created in the Compile Alert view compiles once and then runs as an ordinary saved search.
The Receiver compacts each record's log message and leaves its other fields, such as the Kubernetes namespace, pod and container, as they arrived. The forwarder sends the compact message as the Splunk event and those fields as indexed fields, so they stay searchable by name and in tstats without the app. The splunk-app README covers the Receiver settings the app needs.
Ingestion Flow
The Receiver compacts events at the edge, and Splunk ingests them into Splunk with reduced payload size:
graph LR
    A["<div style='font-size: 14px;'>🗜️ Compact</div><div style='font-size: 10px;'>Compact Events</div>"] --> B["<div style='font-size: 14px;'>📡 Ingest</div><div style='font-size: 10px;'>HEC</div>"]
    B --> C["<div style='font-size: 14px;'>📋 KV Store</div><div style='font-size: 10px;'>Templates</div>"]
    B --> D["<div style='font-size: 14px;'>💾 Index</div><div style='font-size: 10px;'>Encoded</div>"]

    classDef edge fill:#7c3aed88,stroke:#6d28d9,color:#ffffff,stroke-width:2px,rx:8,ry:8
    classDef ingest fill:#9333ea88,stroke:#7c3aed,color:#ffffff,stroke-width:2px,rx:8,ry:8
    classDef store fill:#2563eb88,stroke:#1d4ed8,color:#ffffff,stroke-width:2px,rx:8,ry:8

    class A edge
    class B ingest
    class C,D store
🗜️ Compact: Receiver (Compact mode) compacts events, extracting repetitive patterns into templates
📡 Ingest: the forwarder sends compact events and templates to Splunk over HEC
📋 KV Store: Templates stored in tenx_dml collection for lookup at search time
💾 Index: compact events, each a template hash and its values, with the record's metadata as indexed fields
Search Flow
Two paths reach the same rewrite, then expand the events:
graph LR
    E["<div style='font-size: 14px;'>📊 Dashboard</div><div style='font-size: 10px;'>Panel SPL</div>"] --> F["<div style='font-size: 14px;'>🪝 Hook</div><div style='font-size: 10px;'>Intercept</div>"]
    E2["<div style='font-size: 14px;'>👤 Search Bar</div><div style='font-size: 10px;'>tx</div>"] --> G
    F --> G["<div style='font-size: 14px;'>🔄 Transform</div><div style='font-size: 10px;'>Prefilter + Macro</div>"]
    G --> H["<div style='font-size: 14px;'>📖 Expand</div><div style='font-size: 10px;'>Expand</div>"]
    H --> I["<div style='font-size: 14px;'>📊 Results</div><div style='font-size: 10px;'>Full Data</div>"]

    classDef user fill:#059669,stroke:#047857,color:#ffffff,stroke-width:2px,rx:8,ry:8
    classDef hook fill:#f59e0b,stroke:#d97706,color:#ffffff,stroke-width:2px,rx:8,ry:8
    classDef result fill:#ea580c88,stroke:#c2410c,color:#ffffff,stroke-width:2px,rx:8,ry:8

    class E,E2 user
    class F,G hook
    class H,I result
📊 Dashboard: dashboard.js loads on every classic dashboard in the app carrying it and points the panel's search at the app's REST endpoint, via $.ajaxSetup
👤 Search Bar: | tx <search> runs the same rewrite server-side, and works in saved searches and the REST API too
🔄 Transform: each search word is resolved against the templates, and the SPL becomes a hash prefilter plus the tenx-inflate macro
📖 Expand: the macro joins compact events with templates from the KV Store
📊 Results: fully expanded events, with the original search re-applied so only true matches remain
Scheduled alerts run server-side, where the browser hook never fires. An alert created in the Compile Alert view, or through the /tenx-alert endpoint, is compiled once at save time into a native saved search (a template-hash prefilter plus the tenx-inflate macro), so the scheduler runs an ordinary search with no per-run proxy. The Compile Alert view and the /tenx-alert endpoint handle this, and a recompile pass converts | tx and | tenxsearch alerts to native form and refreshes their prefilters as new templates appear. See SAVE_TIME_ALERTS.md.
Quickstart
Get encoded events flowing to Splunk in under 15 minutes.
Step 1: Install Splunk App
Clone the repository and install to your Splunk apps directory:
git clone https://github.com/log-10x/splunk-app.git
cp -r splunk-app/tenx-for-splunk $SPLUNK_HOME/etc/apps/
$SPLUNK_HOME/bin/splunk restart
In a distributed deployment, install the app on the search heads and on the indexers or heavy forwarders that parse the compact events, where it sets each event's _time.
Prerequisites:
| Requirement | Description |
|---|---|
| Splunk Enterprise | 9.4 through 10.6 (bundled Python 3.9 through 3.13) |
| Admin Access | Required for app installation and KV Store setup |
Verify Installation
After restart, confirm the app appears in Splunk:
- Navigate to Apps → Manage Apps
- Search for "10x"; the list shows Log10x App
- Click the app name to open the Analytics dashboard
Step 2: Create HEC Tokens
Create two HTTP Event Collector tokens in Splunk: one for templates, one for encoded events.
Navigate to HEC Settings:
- Go to Settings → Data inputs → HTTP Event Collector
- Click Global Settings and ensure HEC is Enabled
- Note the HTTP Port Number (default: 8088)
Create Templates Token:
| Setting | Value |
|---|---|
| Name | tenx-templates |
| Source type | tenx_dml_raw_json |
| Index | tenx_dml |
| Enable indexer acknowledgement | Off |
Create Encoded Events Token:
| Setting | Value |
|---|---|
| Name | tenx-encoded |
| Source type | tenx_encoded |
| Index | Your target index |
| Enable indexer acknowledgement | Off |
The app recognizes compact events by their sourcetype. To use a sourcetype other than tenx_encoded, add the app's extraction to that sourcetype's props.conf stanza:
Point the dashboards at these events
The app's Analytics and Diagnostics dashboards find compact events through the tenx-events search macro, which defaults to index=* sourcetype=tenx_encoded. Set it to your index and sourcetype under Settings → Advanced search → Search macros, for example index=my_compact_index sourcetype=tenx_encoded.
Create Index First
If tenx_dml index doesn't exist, create it via Settings → Indexes → New Index before creating the token.
Step 3: Configure Forwarder
Set three options in the Receiver's configuration. Each keeps expansion exact:
| Option | Value | Why |
|---|---|---|
varMaxRecurIndexes |
0 |
Every variable value travels in the event |
timestampZone |
UTC |
The app renders timestamps in UTC |
maxPerObject |
1 |
The app stores one timestamp format per template |
A template that breaks the first or third rule stays compact and carries tenx_expand_refused, naming the reason.
Configure your log forwarder to send encoded events and templates to Splunk.
Start from the Fluent Bit overlay in Deploy, and add receiverOptimize true varMaxRecurIndexes 0 timestampZone UTC timestampMaxPerObject 1 to the sidecar's arguments. In that overlay, set Merge_Log Off in the kubernetes filter (and remove Keep_Log Off), so a JSON log line stays in log, where the Receiver compacts it. Then replace the [OUTPUT] block that writes tenx.* to stdout: the filter below goes under filters: and the two outputs under outputs:.
Each record returns from the Receiver with tenx. in front of its tag. Its log value is compact and its other fields are unchanged. The events output sends the compact message as the Splunk event and the Kubernetes metadata as indexed fields.
# Lift the Kubernetes metadata to top-level keys the output can name.
[FILTER]
    Name          nest
    Match_Regex   ^tenx\.(?!tenx-template).*
    Operation     lift
    Nested_under  kubernetes
    Add_prefix    k8s_
# Templates: one record per new template, for the KV Store.
[OUTPUT]
    Name              splunk
    Match             tenx.tenx-template
    Host              your-splunk-host.com
    Port              8088
    Splunk_Token      YOUR_TEMPLATES_HEC_TOKEN
    event_index       tenx_dml
    event_source      fluent-bit-tenx
    event_sourcetype  tenx_dml_raw_json
    TLS               On
    TLS.Verify        On

# Compact events: the message as the event, the metadata as indexed fields.
[OUTPUT]
    Name              splunk
    Match_Regex       ^tenx\.(?!tenx-template).*
    Host              your-splunk-host.com
    Port              8088
    Splunk_Token      YOUR_ENCODED_EVENTS_HEC_TOKEN
    event_index       your_logs_index
    event_sourcetype  tenx_encoded
    event_key         $log
    event_field       stream $stream
    event_field       k8s_namespace_name $k8s_namespace_name
    event_field       k8s_pod_name $k8s_pod_name
    event_field       k8s_pod_id $k8s_pod_id
    event_field       k8s_container_name $k8s_container_name
    event_field       k8s_container_image $k8s_container_image
    event_field       k8s_docker_id $k8s_docker_id
    event_field       k8s_host $k8s_host
    TLS               On
    TLS.Verify        On
A record key reaches Splunk only through event_key or an event_field line. To keep pod labels, add a second nest filter with Nested_under k8s_labels and Add_prefix k8s_label_, then an event_field line for each label you search on.
Match the returning tags
Both outputs match tags that start with tenx., the prefix the overlay's egress input adds. An output that matches the original tags sends records that never passed through the Receiver, and one that matches tenx-template without the prefix misses the templates, so no event expands.
Start from the Fluentd overlay in Deploy, add receiverOptimize true varMaxRecurIndexes 0 timestampZone UTC timestampMaxPerObject 1 to the sidecar's arguments, and add the Splunk HEC output plugin to the Fluentd image (fluent-gem install fluent-plugin-splunk-hec). In that overlay, replace the @OUTPUT label in 04_outputs.conf with the one below.
Templates return tagged tenx-template. Every other record keeps its tag, with its log value compact and its other fields unchanged.
<label @OUTPUT>
  # Templates: one record per new template, for the KV Store.
  <match tenx-template>
    @type splunk_hec
    hec_host your-splunk-host.com
    hec_port 8088
    hec_token YOUR_TEMPLATES_HEC_TOKEN
    index tenx_dml
    sourcetype tenx_dml_raw_json
    source fluentd-tenx
  </match>

  # HEC rejects a whole batch that contains an empty event.
  <filter **>
    @type grep
    <exclude>
      key log
      pattern /\A\z/
    </exclude>
  </filter>

  # Lift the Kubernetes metadata to top-level keys the output can name.
  <filter **>
    @type record_transformer
    enable_ruby true
    <record>
      k8s_namespace_name ${record.dig("kubernetes", "namespace_name")}
      k8s_pod_name ${record.dig("kubernetes", "pod_name")}
      k8s_container_name ${record.dig("kubernetes", "container_name")}
      k8s_container_image ${record.dig("kubernetes", "container_image")}
      k8s_host ${record.dig("kubernetes", "host")}
    </record>
  </filter>

  # Compact events: the message as the event, the metadata as indexed fields.
  <match **>
    @type splunk_hec
    hec_host your-splunk-host.com
    hec_port 8088
    hec_token YOUR_ENCODED_EVENTS_HEC_TOKEN
    index your_logs_index
    sourcetype tenx_encoded
    <fields>
      stream
      k8s_namespace_name
      k8s_pod_name
      k8s_container_name
      k8s_container_image
      k8s_host
    </fields>
    <format>
      @type single_value
      message_key log
    </format>
  </match>
</label>
A record key reaches Splunk only through message_key or the <fields> list. Add a record_transformer line and a <fields> entry for each further key you search on.
Step 4: Verify End-to-End
Run these SPL queries to confirm everything is working:
1. Check templates are arriving:
Expected: JSON events withtemplateHash and template fields
2. Check KV store is populated:
Expected: Count > 0 (up to 5 minutes for the first templates)3. Check compact events expand:
Expected: Full expanded events, not~hash,var1,var2... format
4. Check the metadata arrives as indexed fields:
Expected: one row per namespace, with no app involvedTemplates indexed before the app
The "Consume KV" saved search stores new templates every 5 minutes. To load templates indexed before the app was installed, run this search once as an admin or power user:
Running it again is safe: templates already stored are skipped.
Step 5: Search from the Search Bar
Splunk's search page loads no app JavaScript, so the hook cannot reach the search bar. Start the search with the app's tx command instead:
Everything after tx is the search, written as it would be on the original data. NOT, OR, AND, phrases, parenthesised groups, wildcards, field conditions, subsearches, inline earliest=/latest= and a trailing pipeline all behave as they do on the original data. The command also runs in saved searches, alerts and the REST API. | tenxsearch searchstring="..." is the same command with the search in one quoted option.
Name compact indexes
A search over a compact sourcetype reaches the original words through tx; without it, a keyword search returns no events. Keep compact indexes out of users' default index sets and name them in searches.
Classic dashboards need no command
Classic dashboards in an app carrying dashboard.js keep their panel SPL unchanged. See Expansion in Other Splunk Apps below.
Verification Checklist
Use this checklist to diagnose issues at each stage of the pipeline.
Templates Arriving in Splunk
Test Query:
| Result | Meaning | Action |
|---|---|---|
| Count > 0 | Templates arriving | Proceed to KV store check |
| Count = 0 | No templates received | Check forwarder config, HEC token, network connectivity |
Check raw event format:
Expected format:
KV Store Populated
Test Query:
| Result | Meaning | Action |
|---|---|---|
| Count > 0 | KV store populated | Proceed to expansion check |
| Count = 0 | Templates not processed | Check "Consume KV" saved search |
Verify saved search configuration:
- Go to Settings → Searches, reports, and alerts
- Find "Consume KV" in the Log10x App
- Verify search string includes:
index=tenx_dml sourcetype=tenx_dml_raw_json - Click Run to manually trigger
Events Expanding Correctly
Test Query:
| Result | Meaning | Action |
|---|---|---|
| Full expanded events | Expansion working | None |
~hash,var1,var2... format |
Events not expanding | Check hash exists in KV store |
{"log":"~hash,..."} |
JSON wrapping | Add event_key $log to forwarder |
Check if template hash exists:
Known Limits
The app stores each compact event whole up to 262,144 bytes (256 KB), the TRUNCATE value on the tenx_encoded sourcetype. Splunk cuts a longer event at index time and adds no marker to it; the cut drops the event's trailing values, so it expands to fewer lines than the original held. A single compact event passes that size when the Receiver groups many lines of one message into it, such as a very long multi-line stack trace. The longest event in the OpenTelemetry demo sample is 25,472 bytes.
A compact event's _time is the time in its original line wherever the template has a timestamp, and the time Splunk indexed it otherwise. The app sets it while events are parsed, so in a distributed deployment it goes on the indexers or heavy forwarders as well as the search heads.
Troubleshooting
Templates Not Populating KV Store
Symptom: | inputlookup tenx-dml-lookup returns 0 rows even though templates exist in tenx_dml index.
Common Causes:
| Cause | Solution |
|---|---|
| Templates indexed before the app was installed, or while "Consume KV" was down | Run index=tenx_dml sourcetype=tenx_dml_raw_json earliest=-30d | sendalert tenx_dml_to_kv once |
| Saved search disabled | Enable in Settings → Searches, reports, and alerts → "Consume KV" |
| Templates in another index | Point the templates HEC token at tenx_dml |
Events Show Raw Encoded Format
Symptom: Events display as ~#ABC123,value1,value2,value3 instead of expanded JSON/text.
Common Causes:
| Cause | Solution |
|---|---|
| Template hash not in KV store | Wait 5 minutes for "Consume KV", or run the backfill search above |
| Hash mismatch (different data) | Verify encoded events match templates in tenx_dml |
| Search ran without expansion | On a dashboard, ensure dashboard.js is in that app; in the search bar, start the search with | tx |
Debug hash lookup:
Events Wrapped in JSON
Symptom: Events arrive as {"log":"~hash,var1,var2..."} instead of raw encoded format.
Cause: Missing event_key $log in Splunk output configuration.
Solution: Add event_key $log to your encoded events OUTPUT section:
[OUTPUT]
    Name              splunk
    Match_Regex       ^tenx\.(?!tenx-template).*
    Host              your-splunk-host.com
    Port              8088
    Splunk_Token      YOUR_TOKEN
    event_index       your_index
    event_key         $log
    TLS               On
This tells Fluent Bit to send only the log field content, not wrap it in JSON.
Cause: Missing <format> block in Splunk HEC output configuration.
Solution: Add format single_value with message_key log to your encoded events match:
<match **>
  @type splunk_hec
  hec_host your-splunk-host.com
  hec_port 8088
  hec_token YOUR_TOKEN
  index your_index
  sourcetype tenx_encoded
  <format>
    @type single_value
    message_key log
  </format>
</match>
This tells Fluentd to send only the log field content, not the full JSON record.
HEC Connection Refused or Timeout
Symptom: Forwarder logs show connection errors to Splunk HEC.
Diagnostic Steps:
-
Test HEC endpoint:
Expected:{"text":"HEC is healthy","code":17} -
Test with token:
Expected:curl -k https://your-splunk:8088/services/collector \ -H "Authorization: Splunk YOUR_TOKEN" \ -d '{"event":"test"}'{"text":"Success","code":0}
| Error | Cause | Solution |
|---|---|---|
| Connection refused | HEC disabled | Enable in Settings → Data inputs → HTTP Event Collector → Global Settings |
| 401 Unauthorized | Invalid token | Verify token value, check token is enabled |
| 403 Forbidden | Token restrictions | Check token's allowed indexes and sourcetypes |
| SSL error | Forwarder does not trust the HEC certificate | Install Splunk's CA certificate on the forwarder host; turn verification off only on a test instance |
Expansion in Other Splunk Apps
dashboard.js loads on every classic dashboard in the app that carries it. The Log10x App ships it, so its own dashboards expand. To expand classic dashboards in another app, copy the file there:
cp $SPLUNK_HOME/etc/apps/tenx-for-splunk/appserver/static/dashboard.js \
   $SPLUNK_HOME/etc/apps/YOUR_APP/appserver/static/
Restart Splunk to load it.
Search bar and Dashboard Studio
The search bar and Dashboard Studio use the tx command, as in the Quickstart.
Programmatic Hook for Custom Views
For custom classic dashboards, include the hook in JavaScript:
Components
| Component | Description |
|---|---|
| Search Hook | JavaScript module routing classic dashboard searches to the REST endpoint |
| tx Command | Generating command running the same rewrite from the search bar, saved searches and alerts |
| Search Handler | REST endpoint transforming SPL queries |
| KV Store | Template patterns for event expansion |
| Inflate Macro | SPL macro joining events with templates |
| Consume KV Search | Scheduled search storing new templates in the KV Store |
| Analytics Dashboard | Compression and template metrics |
| Diagnostics Dashboard | Troubleshooting and verification tools |
This app is open source. View on GitHub.