Query
Storage Streamer queries select matching events from storage via a distributed architecture that guarantees consistent performance regardless of queried data volume.
Each query executes in two phases:
1. Scan — Identifies which files and byte ranges in storage match the target, time range, and search expression. Search expressions support ==, &&, ||, and includes(), and operate on event raw text or fields set by initializers during indexing (e.g. severity_level, http_code, k8s_namespace, country).
2. Stream — Fetches matching byte ranges and streams selected events, filtered by the search expression and optional JavaScript expressions for fine-grained control.
Query Console
The open source Console executes within your infrastructure and provides a web GUI and CLI for submitting queries via SQS or direct REST, with built-in sample queries, dry run preview, and real-time progress tracking via CloudWatch Logs.
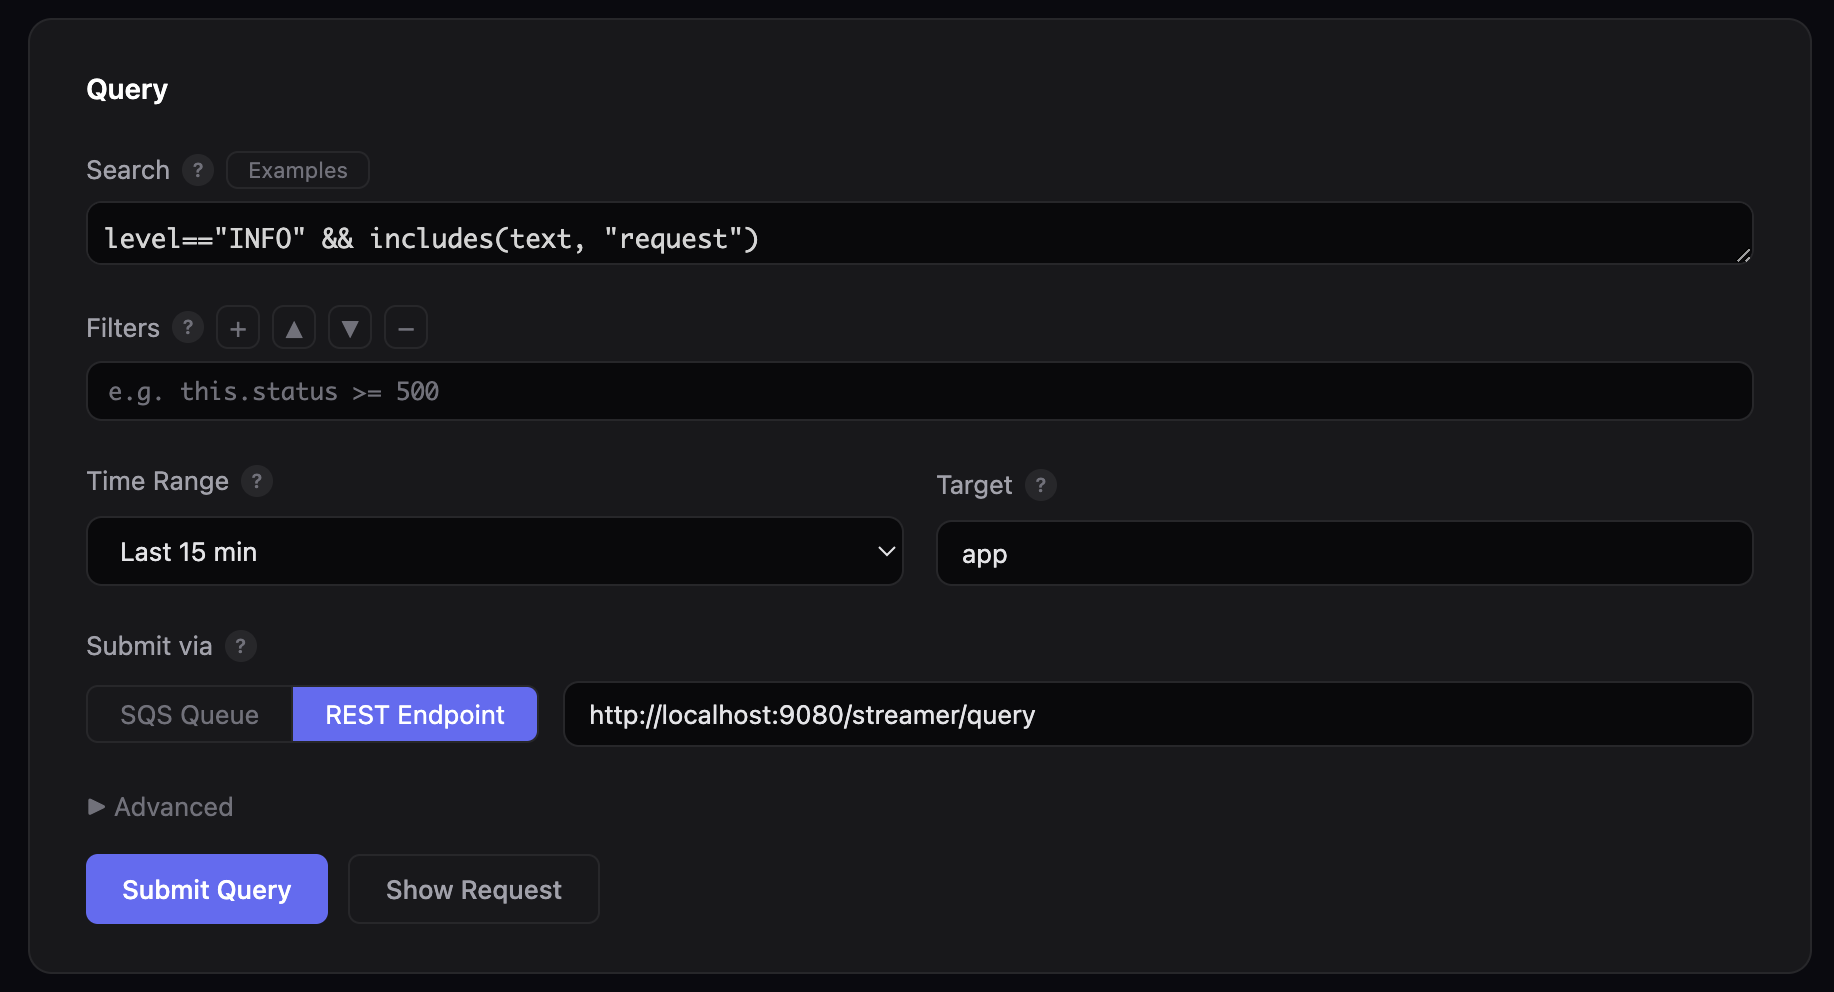
Start the web console to author and submit queries from a browser:
The GUI runs at http://localhost:8080 and opens the browser automatically. Use --port to change the port, or --no-browser to skip the automatic browser launch:
Submit queries directly from the terminal:
# Search for errors in the last 30 minutes
python3 console.py \
  --search 'severity_level=="ERROR"' --since 30m \
  --bucket my-bucket --queue-url $LOG10X_QUERY_QUEUE_URL --follow
# Dry run — print the JSON payload without sending
python3 console.py \
  --search 'http_code=="500"' --since 1h \
  --bucket my-bucket --dry-run
CLI options
| Option | Description |
|---|---|
--search EXPR |
Search expression (==, &&, \|\|, includes()) |
--since TIME |
Relative time range (30s, 5m, 1h, 2d) |
--from / --to |
Absolute time range in epoch milliseconds |
--bucket BUCKET |
S3 bucket containing log files |
--index-bucket BUCKET |
S3 bucket containing index objects (defaults to --bucket) |
--queue-url URL |
SQS queue URL (or set LOG10X_QUERY_QUEUE_URL env var) |
--target PREFIX |
App/service prefix (default: app) |
--processing-time DUR |
Max processing time (default: 60s) |
--result-size SIZE |
Max result volume (default: 10MB) |
--log-levels LEVELS |
Comma-separated log levels (default: ERROR,INFO,PERF) |
--filters EXPR |
JavaScript filter expressions for in-memory filtering |
--no-browser |
Do not open browser automatically when starting web GUI |
--dry-run |
Print JSON payload without sending |
--follow |
Poll CloudWatch Logs until query completes |
--query-id ID |
Monitor an existing query by ID (skips submission, implies --follow) |
--region REGION |
AWS region (default: us-east-1) |
--log-group GROUP |
CloudWatch Logs group (or set TENX_QUERY_LOG_GROUP, default: /log10x/query) |
Submit queries directly via HTTP POST to the streamer endpoint:
curl -X POST http://localhost:8080/streamer/query \
  -H "Content-Type: application/json" \
  -d '{
    "from": "now(\"-5m\")",
    "to": "now()",
    "search": "severity_level == \"ERROR\""
  }'
The query endpoint returns HTTP 200 with a JSON body containing a queryId field:
Use this ID to track query progress via the Web GUI Monitor tab or the CLI --query-id flag:
Request Parameters
| Parameter | Type | Description |
|---|---|---|
from |
Epoch ms | Start of the time range (inclusive). Use now("-5m") for relative time or a literal epoch like 1769076000000. |
to |
Epoch ms | End of the time range (exclusive). Use now() for current time. |
search |
String | Search expression using enriched field names (e.g., severity_level, http_code, k8s_namespace). Must use enriched fields, NOT raw JSON fields like stream, log, or docker. See Sample Queries for working examples. Supports &&, \|\|, ==, and includes(). |
filters |
List | Optional JavaScript expressions applied in-memory after the scan phase. Supports all TenX JavaScript functions including drop(), startsWith(), endsWith(), match(), and TenXLookup.get(). |
processingTime |
Duration | Optional max processing time (e.g., parseDuration("5m")). Defaults to 1 minute. |
resultSize |
Bytes | Optional max result volume (e.g., parseBytes("10MB")). |
Security
Queries can only be initiated by authenticated users with the appropriate AWS IAM permissions. See security architecture for details.
Requirements
- Python 3.6+ (no external dependencies for the web GUI)
- boto3 — required only for SQS submission and CloudWatch Logs polling. Install with
pip3 install boto3 - AWS credentials — configured via
aws configureorAWS_ACCESS_KEY_ID/AWS_SECRET_ACCESS_KEYenvironment variables
The console is at $TENX_MODULES/apps/streamer/console in your local config, or on GitHub at streamer/console.
Sample Queries
Ready-to-use query templates for common scenarios — copy, adjust the time range, and run.
Incident Management
Production errors with stack traces
During an outage, fragmented single-line log entries add noise. This query captures every ERROR and CRITICAL event and keeps only grouped events — multi-line stack traces that contain complete failure signatures:
HTTP 500 errors in a namespace, excluding health checks
Isolate server errors in a specific Kubernetes namespace while filtering out noise from health and readiness probes. The scan phase narrows by http_code and k8s_namespace, then endsWith() removes probe endpoints:
Errors by source code origin
After a deployment, narrow errors to a specific container and code module. The symbol_origin field identifies the source file that produced each event, letting you pinpoint regressions to specific code paths:
Deduplicate repeated stack traces
A single crashing code path can emit thousands of identical stack traces per minute. This query uses TenXCounter to pass only the first 3 occurrences of each unique message_pattern per 5-minute window:
Auditing & Compliance
Failed access attempts with geographic context
SOC 2 and ISO 27001 require logging unauthorized access attempts. This query surfaces all HTTP 401/403 responses, automatically enriched with the originating country via GeoIP lookup on the source IP address:
Admin actions from unexpected regions
Surface admin-level events originating from outside expected geographies. The drop() filter inverts an allow-list — dropping events from known countries so only anomalous origins remain:
curl -X POST http://localhost:8080/streamer/query \
  -H "Content-Type: application/json" \
  -d '{
    "from": "now(\"-24h\")",
    "to": "now()",
    "search": "k8s_container == \"admin-api\" && (severity_level == \"WARN\" || severity_level == \"ERROR\")",
    "filters": ["drop(country == \"US\" || country == \"DE\" || country == \"GB\")"]
  }'
Configuration changes outside approved windows
Change management requires every modification to be traceable to an approved window. This query finds config-related events in the infra namespace, then cross-references each pod against a lookup table of approved changes — dropping approved events so only unauthorized modifications surface:
curl -X POST http://localhost:8080/streamer/query \
  -H "Content-Type: application/json" \
  -d '{
    "from": "now(\"-48h\")",
    "to": "now()",
    "search": "k8s_namespace == \"infra\" && includes(text, \"config\")",
    "filters": ["drop(TenXLookup.get(\"change_windows\", k8s_pod, \"pod\", \"approved\") == \"true\")"]
  }'
Information Security
Brute force detection by country
Credential stuffing attacks generate high volumes of authentication failures from narrow geographic origins. This query uses TenXCounter to count HTTP 401 events per country in 3-minute rolling windows, surfacing only countries exceeding 50 failures:
SQL injection pattern detection
Scan HTTP 400 and 500 responses for common SQL injection patterns using regex matching. Events not matching the pattern are dropped, leaving only those containing suspicious SQL keywords:
Geographic anomalies in production access
Threat hunting for access from outside expected regions. This query finds successful requests to the production namespace and drops events from North America and Europe, surfacing access from any other continent for investigation:
Large response payload detection
Data exfiltration often manifests as requests returning abnormally large responses. This query targets a sensitive container, uses regex to extract the response size, and parses it to keep only responses exceeding 50 MB:
Metric Aggregation
Error count by k8s container
Build a live error leaderboard by counting errors per k8s_container in rolling 5-minute windows. TenXCounter tracks each container independently, and the query surfaces only containers with 10 or more errors:
Traffic volume by continent
Aggregate request volume by continent in hourly windows for capacity planning and CDN configuration. Continents with fewer than 100 requests are dropped, leaving only statistically meaningful traffic segments:
Recurring error pattern frequency
Identify which error types dominate by counting each unique message_pattern in a 30-minute window. Patterns appearing fewer than 25 times are dropped, surfacing only the most frequent error signatures:
Dynamic Regulation
Drop low-severity noise
During incidents, TRACE and DEBUG events add noise without actionable signal. This filter drops them to focus on events at WARN and above, using the severity_level field set at index time:
curl -X POST http://localhost:8080/streamer/query \
  -H "Content-Type: application/json" \
  -d '{
    "from": "now(\"-5m\")",
    "to": "now()",
    "search": "severity_level == \"INFO\" || severity_level == \"WARN\" || severity_level == \"ERROR\" || severity_level == \"CRITICAL\"",
    "filters": ["drop(severity_level == \"TRACE\" || severity_level == \"DEBUG\")"]
  }'
Region-focused monitoring
A regional operations team can restrict query results to a specific continent, dropping all events from other geographies to focus dashboards on local traffic:
Health check and readiness probe removal
Kubernetes health and readiness probes generate high-volume INFO events that obscure application-level logs. Multiple drop() filters remove these known patterns using endsWith() and includes() from the TenX JavaScript API:
Stack trace flood control
Rate-limit repeated stack traces during an outage. TenXCounter tracks each unique combination of message_pattern and symbol_origin in 10-minute windows, passing only the first 5 occurrences and dropping the rest:
curl -X POST http://localhost:8080/streamer/query \
  -H "Content-Type: application/json" \
  -d '{
    "from": "now(\"-1h\")",
    "to": "now()",
    "search": "isGroup == true && (severity_level == \"ERROR\" || severity_level == \"CRITICAL\")",
    "filters": ["drop(TenXCounter.inc(concat(\"flood_\", message_pattern, \"_\", symbol_origin), 1, \"10m\") > 5)"]
  }'