Console Application
The Log10x Console is an open-source application that provides a unified interface for managing your 10x deployments, visualizing cost savings, and configuring environments.
Authentication
Sign in with Google or GitHub. On first login, the Console:
- Authenticates using current provider (Auth0 for SaaS)
- Exchanges your identity token for a 10x API Key
- Creates your default Environment
Features
The main dashboard displays real-time metrics from your 10x deployments:
| Card | Description | Data Source |
|---|---|---|
| Engines | Running 10x Engine instances | tenx_pipeline_up metric |
| Apps | Unique pipeline names | tenx_reported_name labels |
| Forwarders | Edge nodes sending data | tenx_host_name labels |
| Services | User-defined service labels | tenx_user_service labels |
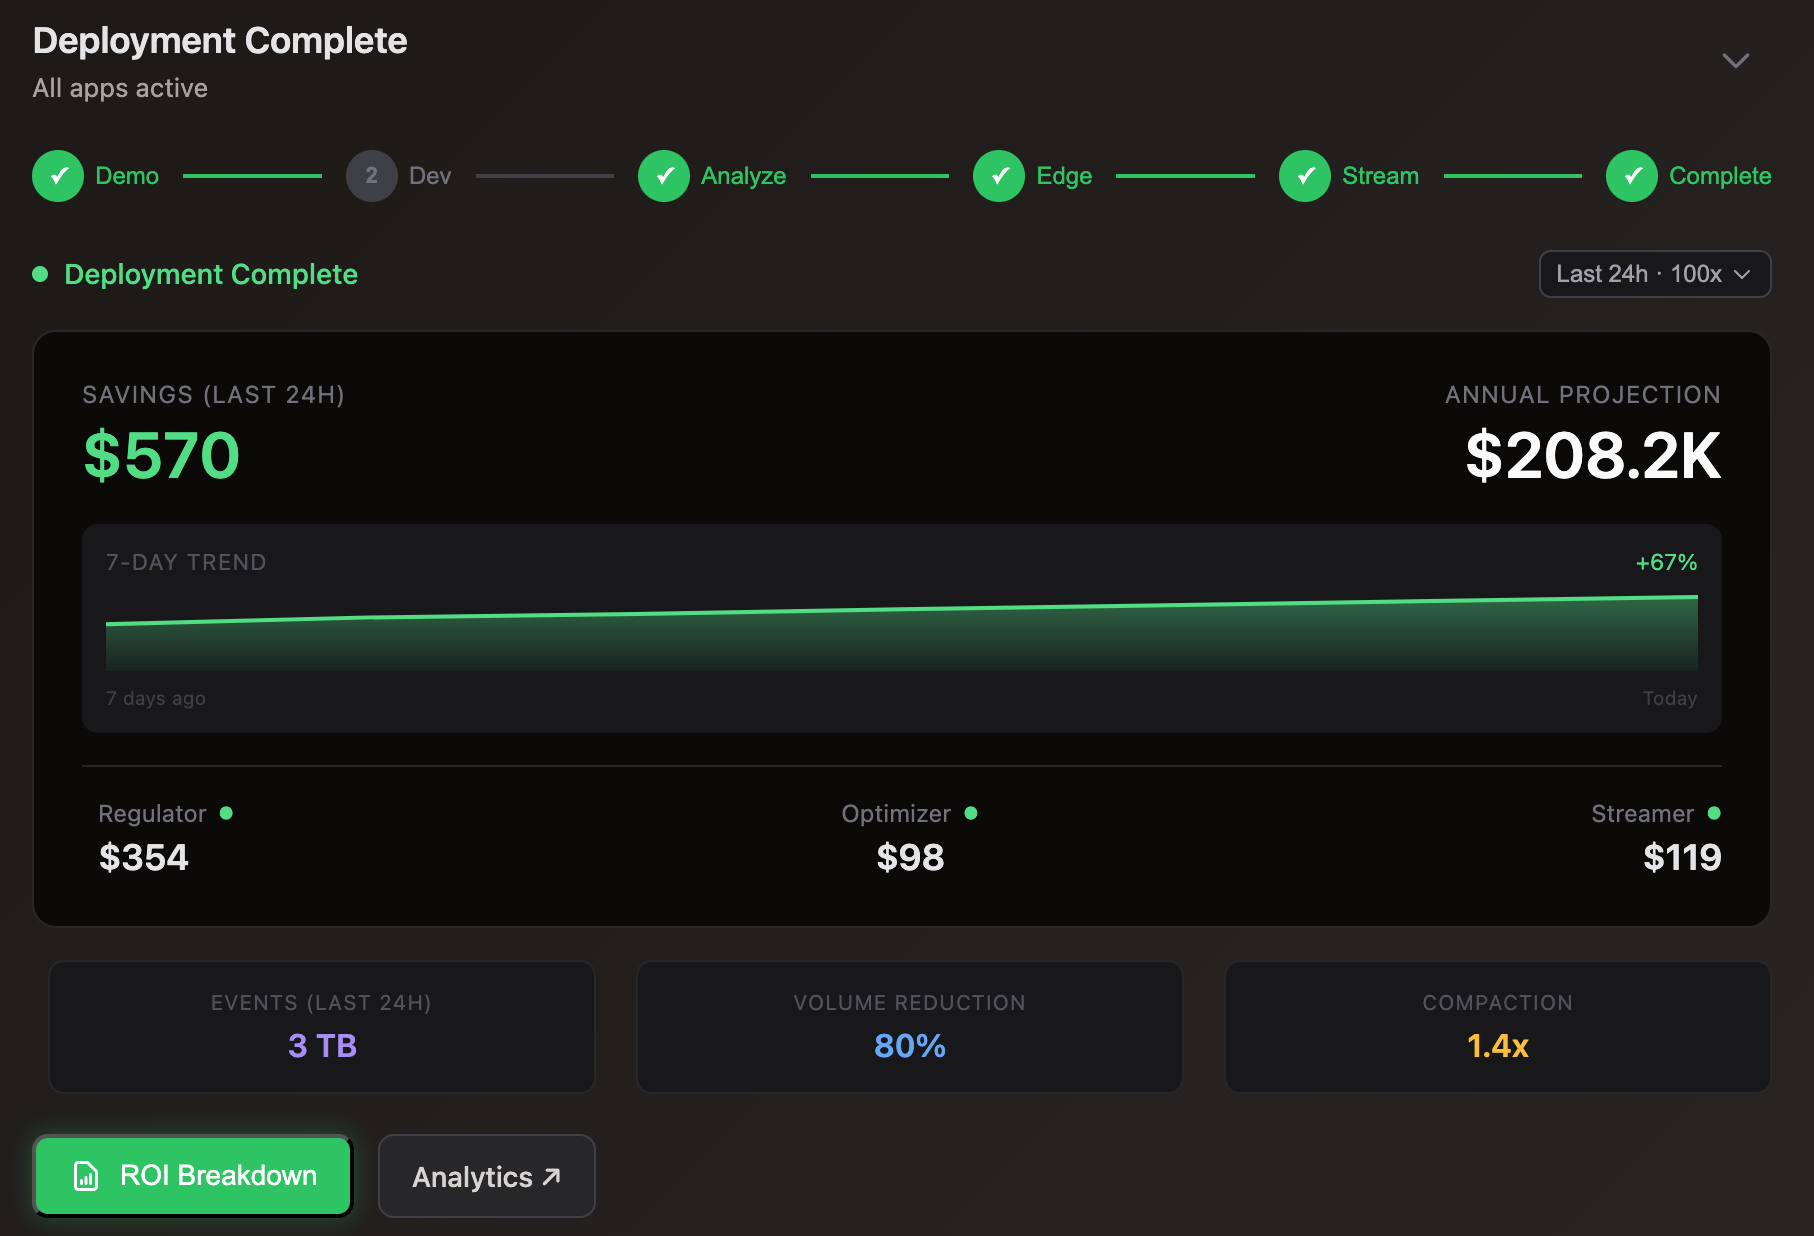
The wizard guides new users through the 10x deployment lifecycle:
| Phase | Description |
|---|---|
| 1. Cloud Reporter | Analyze existing log analytics costs |
| 2. Edge Reporter | Deploy edge-side log visibility |
| 3. Edge Regulator | Apply filtering policies |
| 4. Edge Optimizer | Enable encoding and deduplication |
| 5. Storage Streamer | Configure S3 archival |
| 6. Deployment Complete | View ROI summary and analytics |
Each phase includes live data from your environment when available, or demo data in read-only mode.
The ROI Breakdown modal provides detailed cost analysis:
| Section | Metrics |
|---|---|
| Ingest Volume | Total bytes processed in selected timeframe |
| Savings by Pipeline | Breakdown by regulator, optimizer, streamer |
| Scale Projection | Simulate savings at 10x, 50x, 100x scale |
Configure your per-GB ingestion cost in Settings for accurate projections.
| Setting | Description |
|---|---|
| Ingestion Cost | Your SIEM cost per GB (default: $0.10) |
| Company | Organization name |
| Log Analyzer | Current SIEM platform |
| AI Analysis | Enable/disable AI-powered insights |
API Reference
The Console is a reference implementation of the 10x REST APIs. All data displayed comes from the endpoints documented in the API Reference.
The Console uses only public REST APIs with no special privileges—everything you see in the UI can be replicated with curl commands. The examples below show the exact API calls the Console makes for each feature.
User Management
Get Current User
Retrieves user info, environments, and metadata on login.
Update Profile Settings
Saves ingestion cost, company name, and preferences.
Create Environment
Creates a new isolated environment for metrics.
Rotate API Key
Generates a new API key, invalidating the previous one.
Usage Metrics
The Console dashboard and Usage tab display deployment health metrics. These are the exact queries used:
Engine Instances
Counts all running 10x Engine pods/containers.
curl -s -H "X-10X-Auth: <API_KEY>" \
  "https://prometheus.log10x.com/api/v1/query?query=count(tenx_pipeline_up)"
The tenx_pipeline_up gauge is 1 when a pipeline is healthy, enabling simple counting.
Active 10x Apps
Counts unique 10x app instances (reporter, regulator, optimizer, streamer).
curl -s -H "X-10X-Auth: <API_KEY>" \
  "https://prometheus.log10x.com/api/v1/query?query=count(count%20by%20(tenx_reported_name)%20(tenx_pipeline_up))"
Groups by tenx_reported_name label to count distinct pipeline names.
Forwarders
Counts unique edge hosts sending telemetry data.
curl -s -H "X-10X-Auth: <API_KEY>" \
  "https://prometheus.log10x.com/api/v1/query?query=count(count%20by%20(tenx_host_name)%20(emitted_events_summaryBytes_total%7Btenx_env%3D%22edge%22%2C%20tenx_app%3D~%22reporter%7Cregulator%7Coptimizer%22%7D))"
Decoded query:
count(count by (tenx_host_name) (emitted_events_summaryBytes_total{tenx_env="edge", tenx_app=~"reporter|regulator|optimizer"}))
Filters to edge apps only and groups by hostname to count distinct forwarder nodes.
Monitored Services
Counts unique user services/applications being monitored.
curl -s -H "X-10X-Auth: <API_KEY>" \
  "https://prometheus.log10x.com/api/v1/query?query=count(count%20by%20(tenx_user_service)%20(emitted_events_summaryBytes_total%7Btenx_env%3D%22edge%22%2C%20tenx_app%3D~%22reporter%7Cregulator%7Coptimizer%22%7D))"
Decoded query:
count(count by (tenx_user_service) (emitted_events_summaryBytes_total{tenx_env="edge", tenx_app=~"reporter|regulator|optimizer"}))
The tenx_user_service label is set via the USER_SERVICE environment variable in your pipeline configs.
ROI Calculations
Total Ingest Volume (24h)
Sum of all bytes processed in the last 24 hours.
Regulator Savings
Bytes filtered by policy-based regulation.
# Before regulation (all events)
curl -s -H "X-10X-Auth: <API_KEY>" \
"https://prometheus.log10x.com/api/v1/query?query=sum(increase(all_events_summaryBytes_total%7Btenx_app%3D~%22regulator%7Coptimizer%22%7D[24h]))"
# After regulation (emitted events)
curl -s -H "X-10X-Auth: <API_KEY>" \
"https://prometheus.log10x.com/api/v1/query?query=sum(increase(emitted_events_summaryBytes_total%7Btenx_app%3D~%22regulator%7Coptimizer%22%7D[24h]))"
Savings = (before - after) / before
Optimizer Reduction
Bytes saved through template-based optimization.
# Original size
curl -s -H "X-10X-Auth: <API_KEY>" \
  "https://prometheus.log10x.com/api/v1/query?query=sum(increase(emitted_events_summaryBytes_total[24h]))"
# Optimized size
curl -s -H "X-10X-Auth: <API_KEY>" \
"https://prometheus.log10x.com/api/v1/query?query=sum(increase(emitted_events_optimized_size_total[24h]))"
Reduction ratio = optimized / original
Streamer Diversion
Bytes diverted to S3 vs sent to SIEM.
# Sent to SIEM (indexed)
curl -s -H "X-10X-Auth: <API_KEY>" \
  "https://prometheus.log10x.com/api/v1/query?query=sum(increase(indexed_events_bytes_total[24h]))"

# Sent to S3 (streamed)
curl -s -H "X-10X-Auth: <API_KEY>" \
  "https://prometheus.log10x.com/api/v1/query?query=sum(increase(streamed_events_summaryBytes_total[24h]))"
Top 10 Log Patterns
Highest volume message patterns for optimization targeting.
Debug Log Viewer
Click the button in the bottom-right corner to open the Debug Log Viewer. This panel shows all API requests made by the Console in real-time, including:
- Request/response timing — See exactly how long each API call takes
- HTTP status codes — Quickly identify failed requests
- Auth flow details — Track Auth0 initialization and token exchange
- Metrics queries — View the Prometheus queries powering the dashboard
Use the log viewer to:
- Debug authentication issues by viewing the exact Auth0 domain and API endpoints being called
- Share logs with support — click Copy or ↓ to export all logs as JSON
- Filter by category (API, Errors, Auth) to focus on specific issues
Troubleshooting
If you encounter issues, open the log viewer, reproduce the problem, then click Copy to capture the diagnostic data. This includes timestamps, response codes, and configuration details needed for debugging.
Source Code
The Console is open-source and serves as a reference implementation:
| Component | Repository |
|---|---|
| Console SPA | index.html.tpl |
| User Service API | lambdas/user-service-go/ |
| Terraform Infrastructure | terraform/console/ |
Build your own dashboard or integrate 10x metrics into existing tools using the same APIs.