Storage Streamer
The Storage Streamer app stores logs in object storage (S3, Azure Blobs) and streams selected events to your existing log analyzer (Splunk, Datadog, Elastic) on demand. Ingest only what you query — typically 5-30% of total volume — and cut analytics costs by 70-95%.
Stream On-demand
Configure your existing log shippers (Fluent Bit, Fluentd, Vector) to write to S3 alongside or instead of your analyzer. Storage Streamer indexes files as they arrive and makes them queryable by time range, source, and keywords — matching events stream to Splunk, Datadog, Elastic, or CloudWatch within seconds.
Ingestion costs apply only to what you retrieve — typically 5-30% of stored volume. The rest stays in S3 at $0.023/GB/month.
| Scenario | Current | Diverted to S3 | With Streamer | Annual Savings |
|---|---|---|---|---|
| Splunk, 5 TB/day @ $1.50/GB | $225K/mo | 75% | $60K/mo | $2M/yr |
| Datadog, 1 TB/day @ $2.50/GB | $75K/mo | 80% | $16K/mo | $708K/yr |
| Elastic, 2 TB/day @ $1.50/GB | $90K/mo | 80% | $20K/mo | $840K/yr |
Integrate the Edge Optimizer to losslessly compact events before they upload, reducing S3 storage costs by an additional 50%. See pricing for Log10x platform costs.
Use Cases
Stream events ad-hoc via the REST API, or on a recurring schedule using Kubernetes CronJobs. Each use case below shows the workflow, expected retrieval times, and links to sample queries you can run locally.
Incident investigation
Search months of historical logs during an incident without pre-paying for ingestion. Query by time range, severity, and keywords — matching events stream to your Splunk, Datadog, or Elastic instance within seconds.
How it works: POST a query to the REST API specifying a time range and search expression (e.g., severity_level == "ERROR" && k8s_namespace == "payments"). Indexes identify matching files in under 1 second. Events stream via Fluent Bit with original timestamps preserved — they appear in the correct time range in your existing Splunk, Datadog, or Elastic dashboards. See sample queries for examples filtering by severity, HTTP status, country, and k8s namespace.
Retrieval times (S3 Standard, single query worker): ~100 events in 2-5 seconds, ~10K events in 10-30 seconds. Index lookups take under 1 second regardless of data volume. Retrieval time scales with result set size, not total stored volume. For larger result sets, extend the processing time window. Deploy multiple query workers to parallelize retrieval for higher throughput.
Tip: Keep the last 24-48 hours of high-severity logs (ERROR, FATAL) ingested directly into your primary SIEM for sub-second alerting — the Level Classifier automatically enriches every event with a severity level for filtering. Use the Streamer for historical investigation beyond that window — this gives you fast incident response without paying to index months of full-volume data.
Example savings (Splunk, 5 TB/day): Index only the last 48 hours in Splunk for alerting (~$15K/mo). Query older data from S3 on-demand during incidents — S3 storage costs ~$3.5K/mo for 150 TB. Savings vs. 30-day full indexing: ~$2.4M/yr.
Scheduled dashboard population
Populate Splunk, Datadog, or Elastic dashboards continuously from S3 without manual queries. A Kubernetes CronJob runs on a schedule (e.g., every hour), streams the last hour's events, and your existing dashboards update automatically.
How it works: Deploy a CronJob using the Helm chart with a recurring query. The rate regulator applies cost-aware sampling before streaming — using the severity level assigned by the Level Classifier to retain all ERRORs, throttle DEBUG, and enforce per-hour budget caps. You control exactly what your analyzer ingests and what it costs.
Output targets: Configure the Fluent Bit sidecar for Splunk (HEC), Elasticsearch, Datadog, or CloudWatch. Events arrive with original timestamps, sources, and tags preserved — existing dashboards and alerts continue working without changes.
Example savings (Datadog, 1 TB/day): Stream 20% of volume via hourly CronJob — ERRORs and key services only. Datadog ingestion drops from $75K/mo to ~$15K/mo. The other 80% stays in S3 at ~$700/mo. Savings: ~$708K/yr.
Compliance and audit
Retain years of logs in S3 at $0.023/GB/month to meet regulatory requirements (SOX, HIPAA, PCI-DSS). Stream to Splunk, Datadog, or Elastic only when auditors request specific time ranges or events. Pay storage costs year-round, ingestion costs only during audits.
How it works: Query a 6-month or multi-year time range with a targeted search expression — for example, all authentication events or all transactions for a specific account. Indexes skip 99%+ of files, so even broad time ranges resolve in seconds. Cap the result volume to control costs — see the result size limit example.
Retention: Use S3 Lifecycle policies to automate retention — transition logs to Glacier after 90 days for long-term archival at ~$0.004/GB/month, and expire objects after the required retention period. Indexes remain in S3 Standard for fast lookups regardless of where the data tier sits.
Example savings (Elastic, 2 TB/day, 1-year retention): Retaining 730 TB in Elasticsearch costs ~$90K/mo in cluster resources. In S3, the same data costs ~$17K/mo — or ~$3K/mo after Glacier transition. Stream to Elastic only during audits. Savings: ~$1M/yr.
Metric aggregation
Convert millions of S3 events into metric data points (counts, rates, distributions) on-the-fly and publish to time-series DBs. For Datadog users: custom metrics cost a fraction of indexed log pricing — aggregate error rates, request counts, or latency percentiles from S3 logs and publish directly to Datadog Metrics, bypassing log ingestion entirely.
How it works: Configure metric outputs in your pipeline to aggregate events before publishing. Supported targets include Prometheus Remote Write, Datadog, CloudWatch, and Elastic. The rate regulator applies cost-aware sampling before aggregation, ensuring only high-value events contribute to metrics.
Example savings (Datadog, 1 TB/day): 300 GB/day of infrastructure logs (health checks, latency, status codes) only need metrics, not full-text search. Aggregate to Datadog Metrics instead of indexing — skip $22.5K/mo in log ingestion. Savings: ~$270K/yr.
Workflow
The app operates in two phases for efficient data handling: Index builds searchable filters when files upload to storage, and Query retrieves and streams matching events on-demand to log analyzers and dashboards.
Index
The Index phase executes when log files upload to storage (e.g., S3 bucket) to enable in-place querying.
graph LR
A["<div style='font-size: 14px;'>⚡ Trigger</div><div style='font-size: 10px; text-align: center;'>File Upload</div>"] --> B["<div style='font-size: 14px;'>📡 Receive</div><div style='font-size: 10px; text-align: center;'>Read Events</div>"]
B --> C["<div style='font-size: 14px;'>🔄 Transform</div><div style='font-size: 10px; text-align: center;'>Parse & Structure</div>"]
C --> D["<div style='font-size: 14px;'>🎁 Enrich</div><div style='font-size: 10px; text-align: center;'>Add Context</div>"]
D --> E["<div style='font-size: 14px;'>📝 Write</div><div style='font-size: 10px; text-align: center;'>Search Indexes</div>"]
classDef trigger fill:#7c3aed88,stroke:#6d28d9,color:#ffffff,stroke-width:2px,rx:8,ry:8
classDef receive fill:#9333ea88,stroke:#7c3aed,color:#ffffff,stroke-width:2px,rx:8,ry:8
classDef transform fill:#2563eb88,stroke:#1d4ed8,color:#ffffff,stroke-width:2px,rx:8,ry:8
classDef enrich fill:#059669,stroke:#047857,color:#ffffff,stroke-width:2px,rx:8,ry:8
classDef write fill:#ea580c88,stroke:#c2410c,color:#ffffff,stroke-width:2px,rx:8,ry:8
class A trigger
class B receive
class C transform
class D enrich
class E write⚡ Trigger: File upload events to object storage send notifications directly to the Index SQS queue for asynchronous processing by index workers
📡 Receive: Read log events from the uploaded file in object storage (S3, Azure Blobs)
🔄 Transform: Parse log events into structured objects with typed fields (severity, timestamp, source, message)
🎁 Enrich: Add context via enrichment rules — geo-IP location, severity classification, k8s metadata, lookup tables
📝 Write: Generate lightweight search indexes that map keywords and fields to specific files — enabling queries to skip 99%+ of files
Architecture
Environments generate vast app/infra logs daily, but users consume only a fraction via alerts, dashboards, and queries. Unused data drives over 80% of licensing, compute, and storage costs.
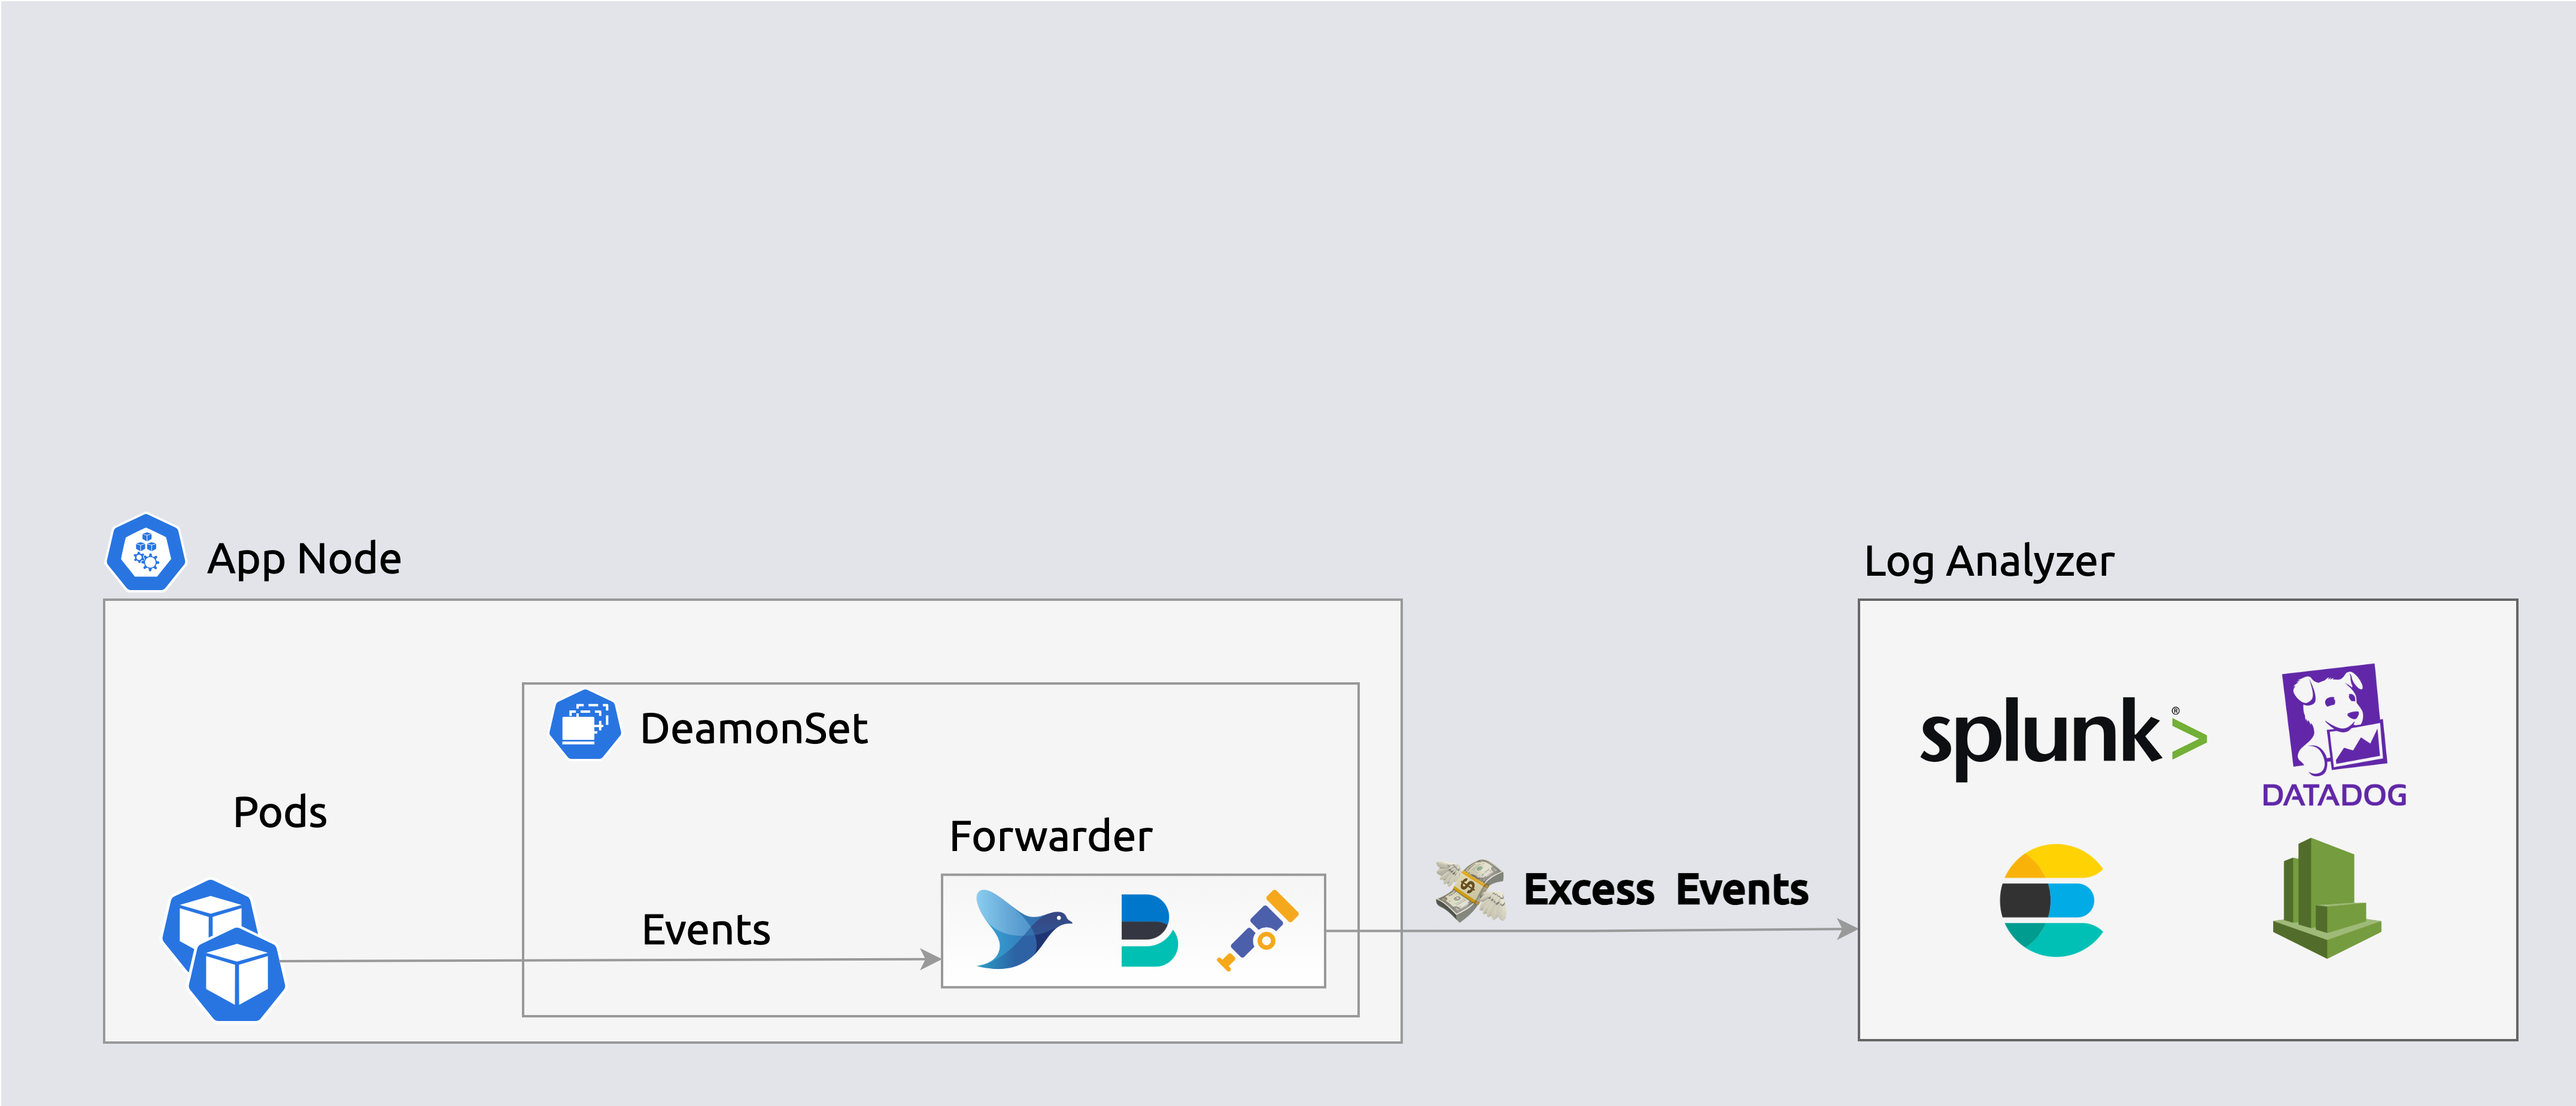
 Forwarders ship events to log analyzers indiscriminately
S3 uploads send event notifications to an SQS queue, triggering index workers to generate lightweight search indexes that map keywords and fields to specific files — enabling queries to skip 99%+ of files.
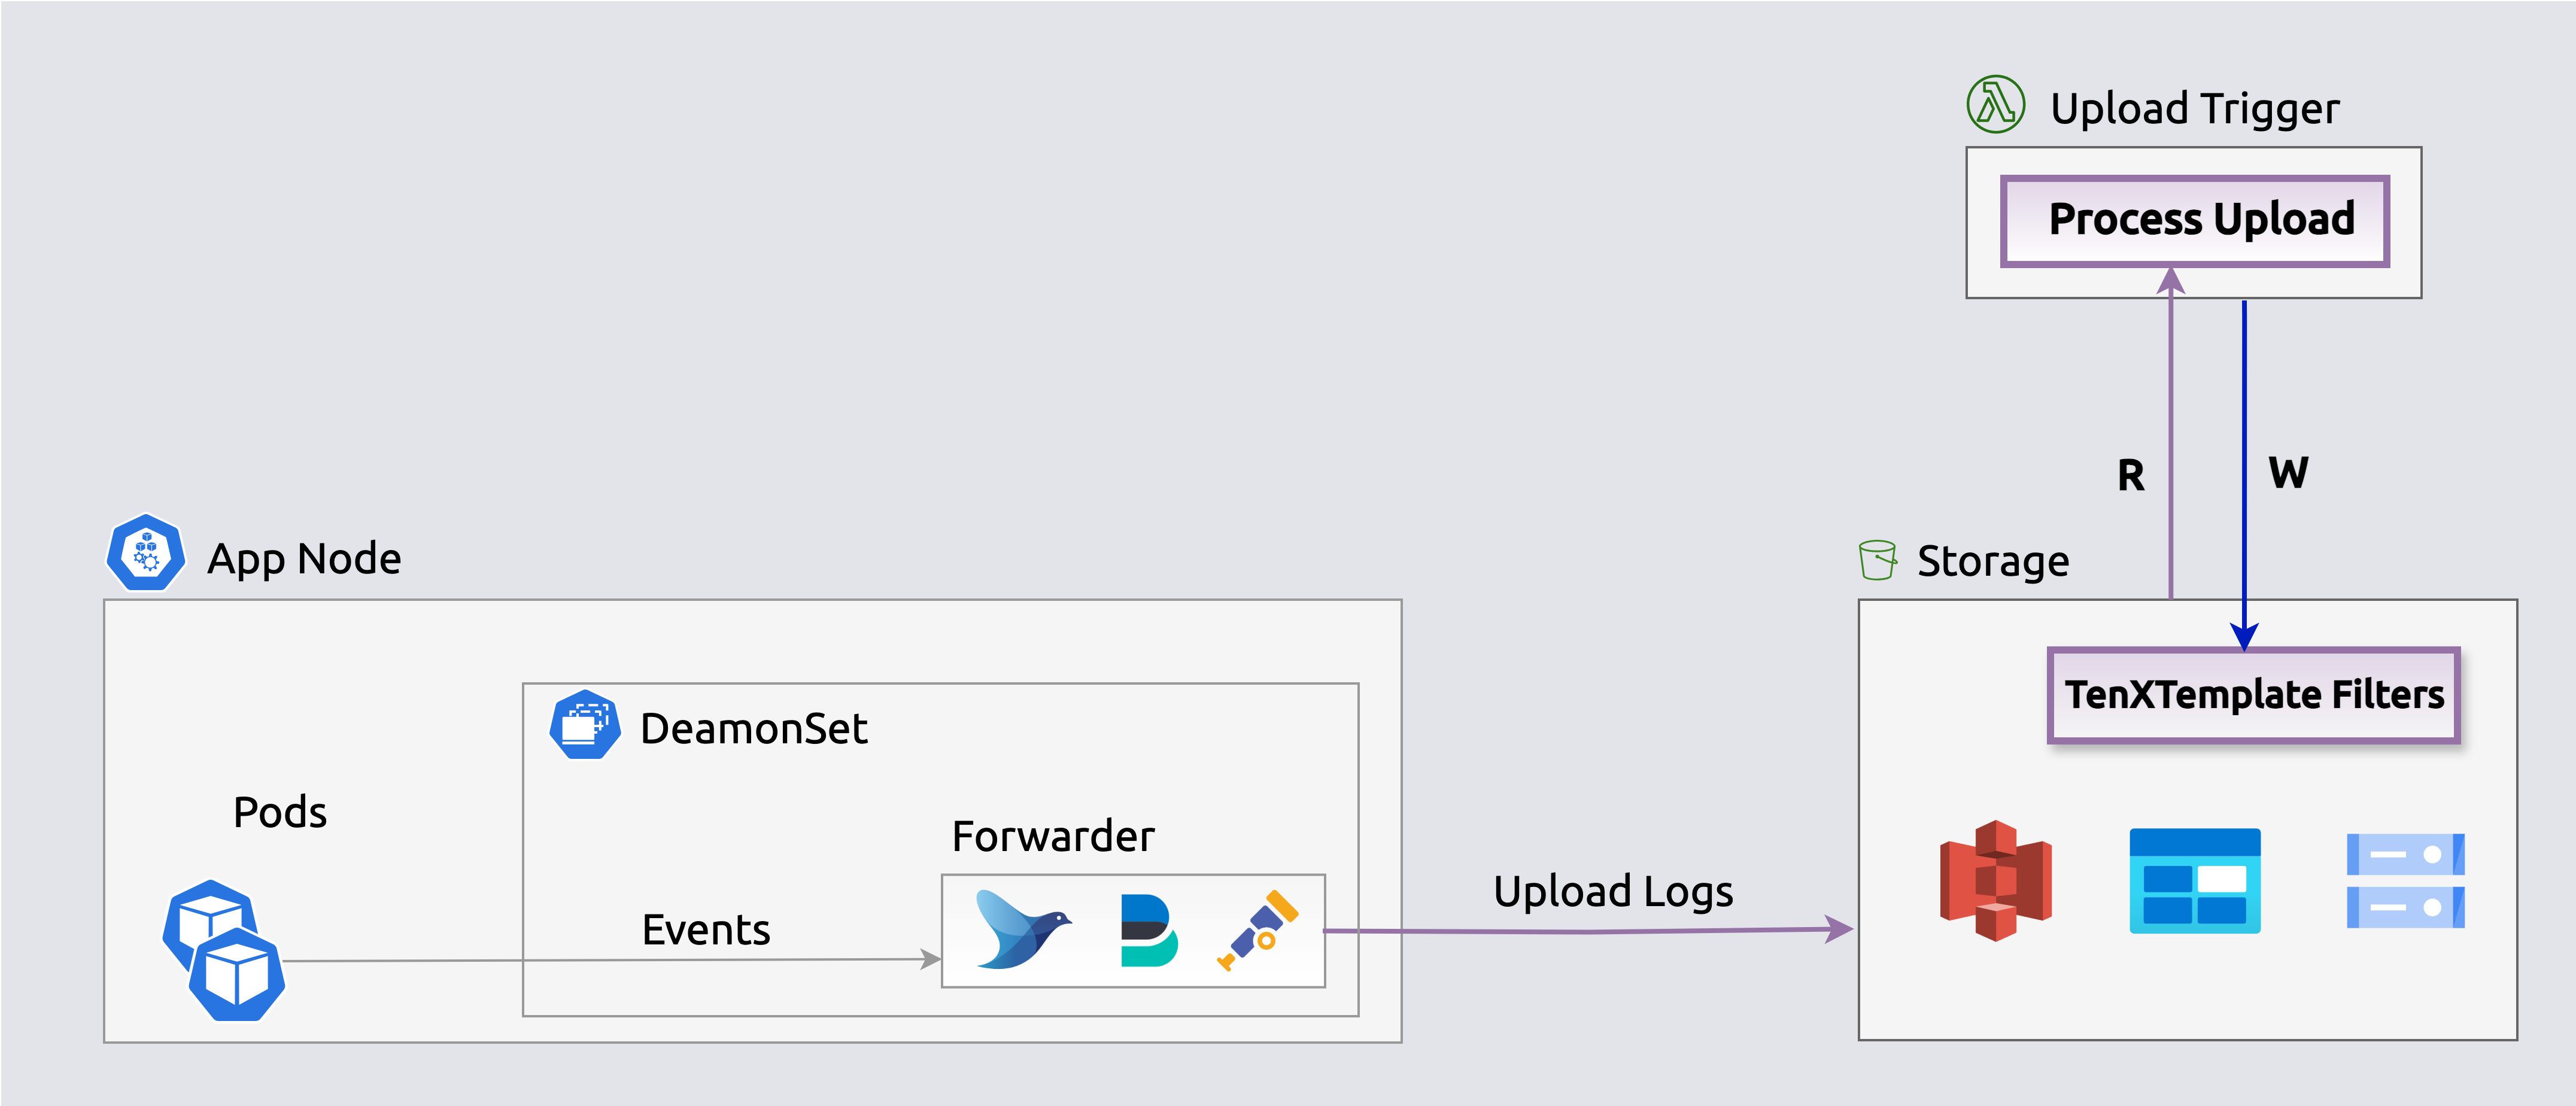
 Search indexes enable querying events in-place
The Edge-optimizer app reduces storage costs by over 50% by losslessly compacting events before they upload. Stream queries expand events on-the-fly for processing and streaming.
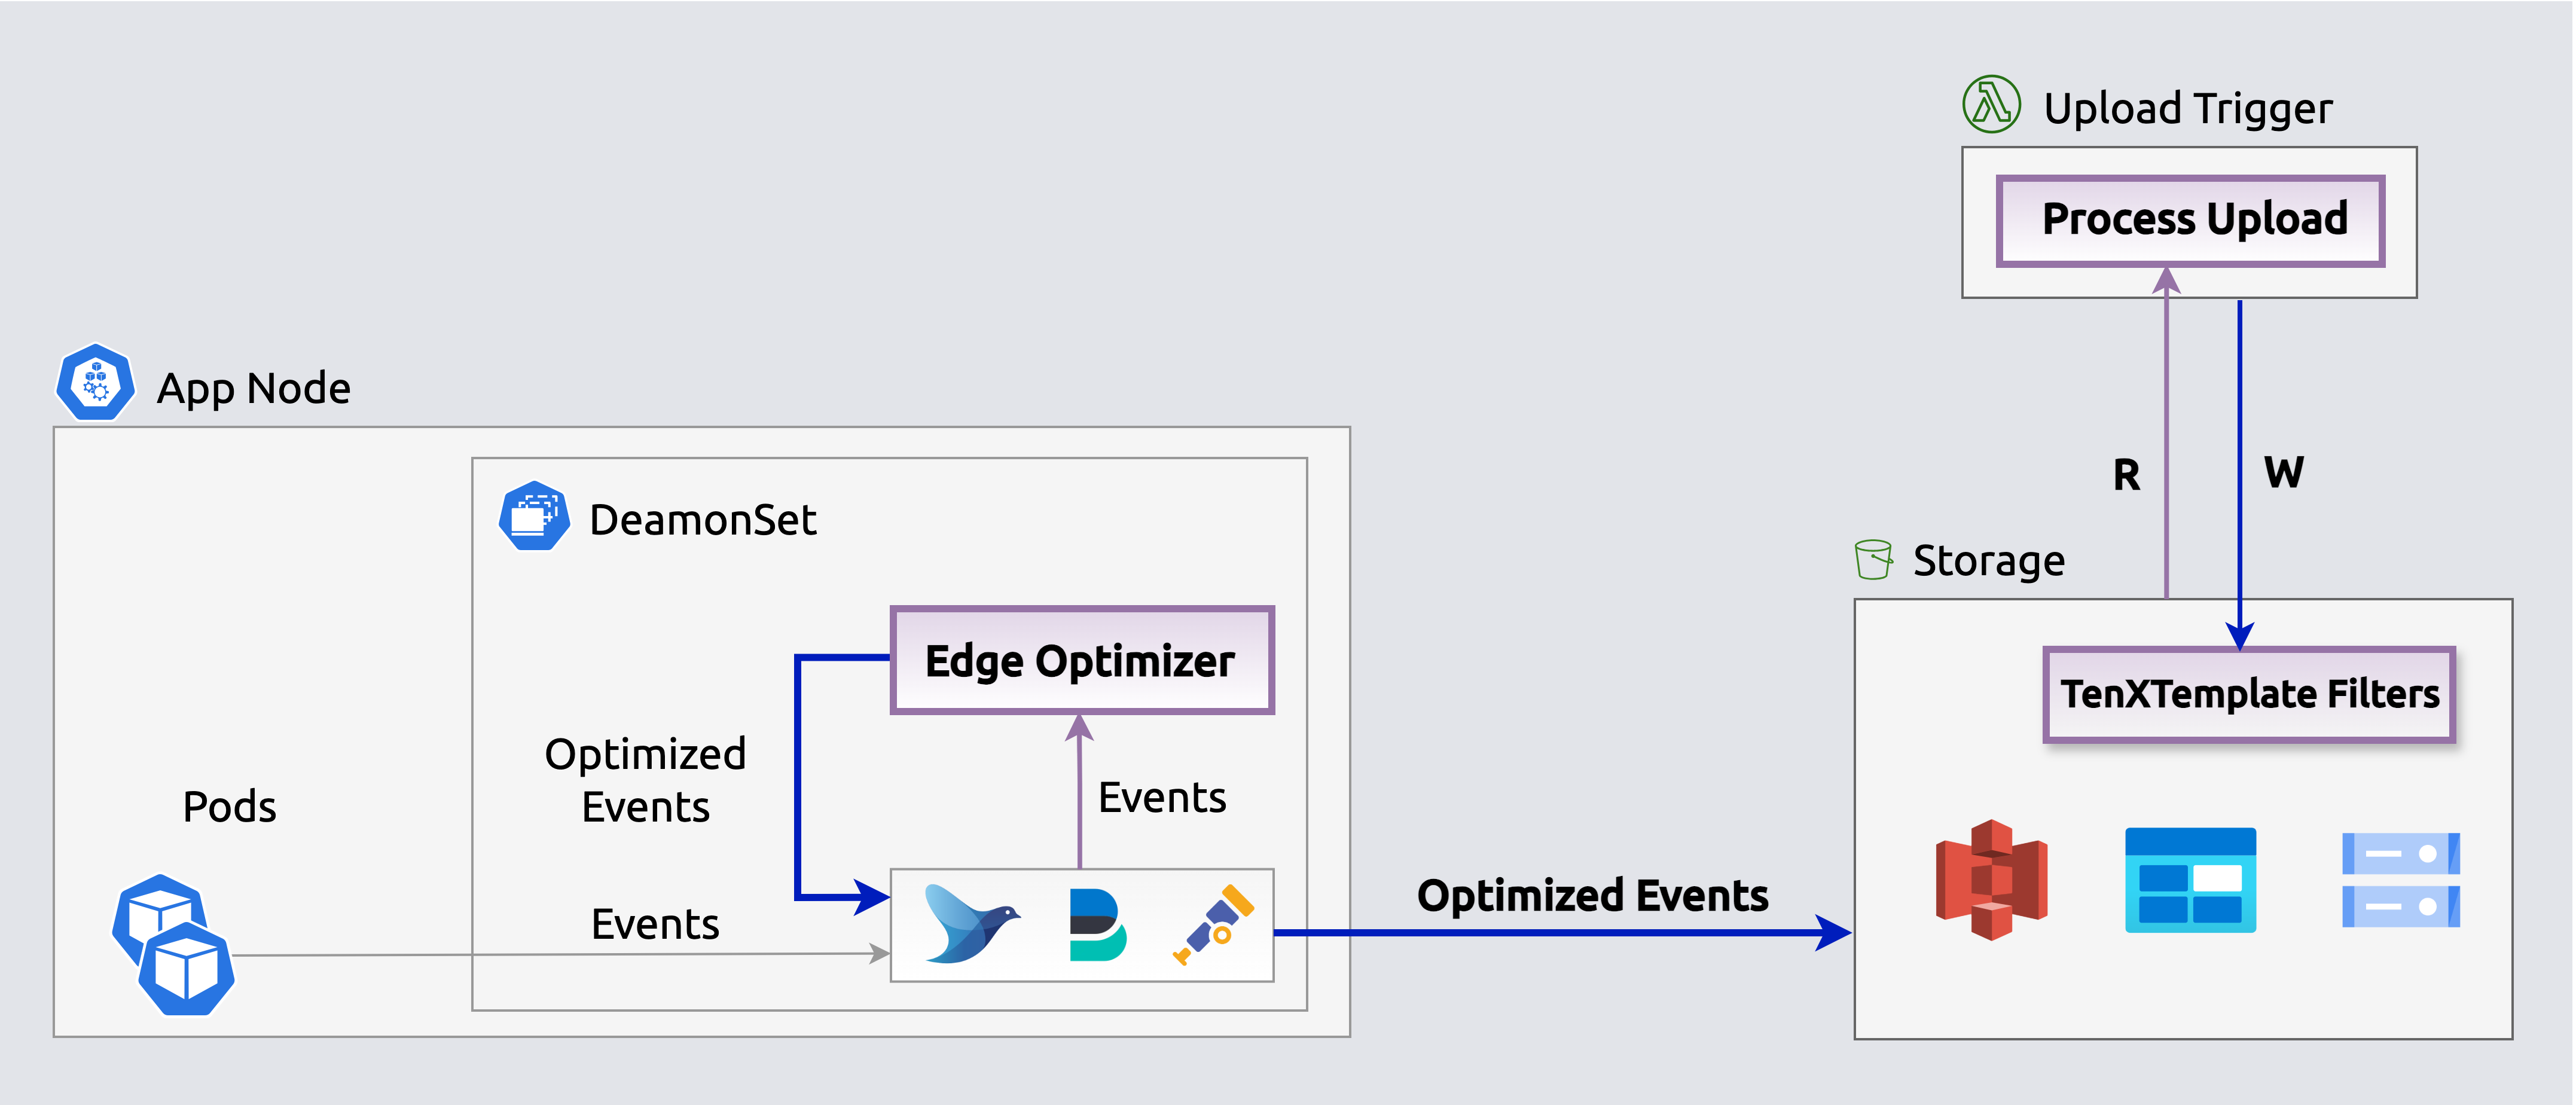 Edge Optimizers losslessly compact events before they upload.
Query
Execute queries periodically (e.g., k8s CronJob) or on-demand via the REST API to populate log analytics dashboards and alerts (e.g., Splunk, Datadog) with selected events.
graph LR
A["<div style='font-size: 14px;'>⏰ Trigger</div><div style='font-size: 10px; text-align: center;'>Cron/API Call</div>"] --> B["<div style='font-size: 14px;'>📥 Query</div><div style='font-size: 10px; text-align: center;'>Filter & Fetch Events</div>"]
B --> C["<div style='font-size: 14px;'>🔄 Transform</div><div style='font-size: 10px; text-align: center;'>Parse & Structure</div>"]
C --> D["<div style='font-size: 14px;'>🎁 Enrich</div><div style='font-size: 10px; text-align: center;'>Add Context</div>"]
D --> E["<div style='font-size: 14px;'>🚦 Regulate</div><div style='font-size: 10px; text-align: center;'>Filter Events</div>"]
E --> F["<div style='font-size: 14px;'>📤 Stream</div><div style='font-size: 10px; text-align: center;'>Send to Targets</div>"]
classDef trigger fill:#7c3aed88,stroke:#6d28d9,color:#ffffff,stroke-width:2px,rx:8,ry:8
classDef query fill:#2563eb88,stroke:#1d4ed8,color:#ffffff,stroke-width:2px,rx:8,ry:8
classDef transform fill:#059669,stroke:#047857,color:#ffffff,stroke-width:2px,rx:8,ry:8
classDef enrich fill:#ea580c88,stroke:#c2410c,color:#ffffff,stroke-width:2px,rx:8,ry:8
classDef regulate fill:#dc2626,stroke:#b91c1c,color:#ffffff,stroke-width:2px,rx:8,ry:8
classDef stream fill:#16a34a88,stroke:#15803d,color:#ffffff,stroke-width:2px,rx:8,ry:8
class A trigger
class B query
class C transform
class D enrich
class E regulate
class F stream⏰ Trigger: Queries initiated via scheduled CronJobs or REST API calls
📥 Query: Identify and retrieve relevant events from storage by app, timeframe, keywords, or custom criteria
🔄 Transform: Parse fetched events into structured objects with typed fields
🎁 Enrich: Add context via enrichment rules — geo-IP, severity, k8s metadata
🚦 Regulate: Cost-aware sampling before streaming — severity-boosted retention (ERRORs always kept, DEBUG throttled), per-hour budget caps, and per-event-type share limits. Controls exactly what reaches your analyzer and what it costs
📤 Stream: Output regulated events to log analyzers (Splunk, Elastic, Datadog) via Fluent Bit, or aggregate into metrics and publish to time-series DBs (Datadog, Prometheus). Horizontal scaling ensures consistent fetch times
Operational monitoring: Each worker exposes health endpoints via SmallRye Health (liveness + readiness probes). SQS queue depth and message age metrics track indexing and query backlog — set CloudWatch alarms on ApproximateAgeOfOldestMessage to detect processing delays. Failed messages route to SQS dead-letter queues for inspection. See the deploy guide for health check configuration and scaling options.
Architecture
Enrich, regulate, and stream selected events to log analyzers (e.g., Elastic, Splunk, Datadog) via an embedded Fluent Bit output to populate dashboards, queries, and alerts. The rate regulator applies cost-aware sampling before streaming — severity-boosted retention (ERRORs always forwarded, DEBUG throttled) with per-hour budget enforcement.
 Stream selected events from storage to log analyzers
Enrich, regulate, aggregate and publish events on-the-fly as metrics to time-series outputs (e.g., Datadog, Prometheus) to populate dashboards, queries and alerts. The rate regulator applies cost-aware sampling (severity-boosted, budget-capped) before aggregation, ensuring only high-value events contribute to metrics. Aggregated metrics are published directly to Datadog's metrics API, Prometheus, or other time-series endpoints.
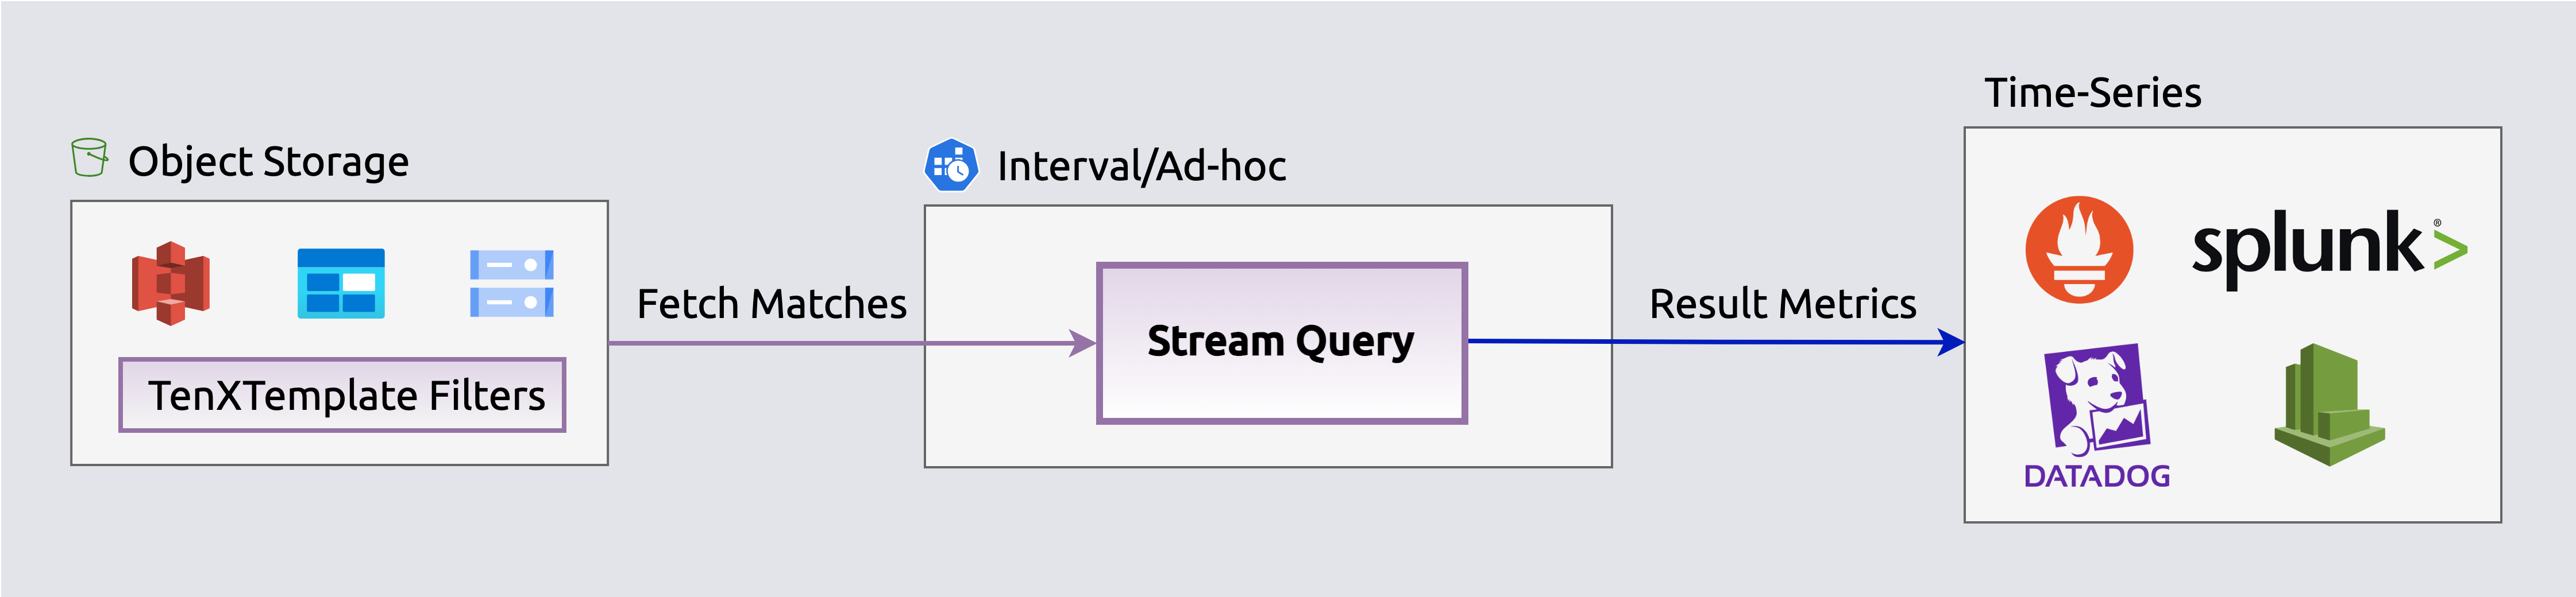 Stream aggregated events as metrics to time-series DBs
Infrastructure & Security
Storage Streamer runs entirely within your own Kubernetes cluster — no log data leaves your infrastructure.
Key guarantees: - All processing happens in your cluster — EKS Deployment under your control - No log data is accessed automatically — you control which events to query and stream - Your data stays in your S3 bucket — index and queries operate only on your S3 files - Works on AWS with optional Azure Blob Storage support on the roadmap - Credentials managed in Kubernetes Secrets — never stored in config files
See the Cloud FAQ for complete details on deployment, data access, and security guarantees.
This app is defined in streamer/app.yaml.